Pt. 420, App. C
Appendix C to Part 420—Risk Analysis
(a) Introduction
(1) This appendix provides a method for an applicant to estimate the expected casualty (Ec) for a launch of a guided expendable launch vehicle using a flight corridor generated either by appendix A or appendix B. This appendix also provides an applicant options to simplify the method where population at risk is minimal.
(2) An applicant shall perform a risk analysis when a populated area is located within a flight corridor defined by either appendix A or appendix B. If the estimated expected casualty exceeds 1 × 10⁻⁴, an applicant may either modify its proposal, or if the flight corridor used was generated by the appendix A method, use the appendix B method to narrow the flight corridor and then redo the overflight risk analysis pursuant to this appendix. If the estimated expected casualty still exceeds 1 × 10⁻⁴, the FAA will not approve the location of the proposed launch point.
(b) Data Requirements
(1) An applicant shall obtain the data specified by subparagraphs (b)(2) and (3) and summarized in table C-1. Table C-1 provides sources where an applicant may obtain data acceptable to the FAA. An applicant must also employ the flight corridor information from appendix A or B, including flight azimuth and, for an appendix B flight corridor, trajectory information.
(2) Population data. Total population (N) and the total landmass area within a populated area (A) are required. Population data up to and including 100 nm from the launch point are required at the U.S. census block group level. Population data downrange from 100 nm are required at no greater than 1° × 1° latitude/longitude grid coordinates.
(3) Launch vehicle data. Launch vehicle data consist of the launch vehicle failure probability (Pf), the launch vehicle effective casualty area (Ac), trajectory position data, and the overflight dwell time (td). The failure probability is a constant (Pf = 0.10) for a guided orbital or suborbital expendable launch vehicle. Table C-3 provides effective casualty area data based on IIP range. Trajectory position information is provided from distance computations provided by this appendix for an appendix A flight corridor, or trajectory data used in appendix B for an appendix B flight corridor. The dwell time (td) may be determined from trajectory data produced when creating an appendix B flight corridor.
Table C-1—Overflight Analysis Data Requirements
Data category | Data item | Data source |
|---|---|---|
Population Data | Total population within a populated area (N) | Within 100 nm of the launch point: U.S. census data at the census block-group level. Downrange from 100 nm beyond the launch point, world population data are available from: |
Total landmass area within the populated area (A) | Carbon Dioxide Information Analysis Center (CDIAC) Oak Ridge National LaboratoryDatabase—Global Population Distribution (1990), Terrestrial Area and Country Name Information on a One by One Degree Grid Cell Basis (DB1016 (8-1996) | |
Launch Vehicle Data | Failure probability—Pf = 0.10 | N/A. |
Effective casualty area (Ac) | See table C-3. | |
Overflight dwell time | Determined by range from the launch point or trajectory used by applicant. | |
Nominal trajectory data (for an appendix B flight corridor only) | See appendix B, table B-1. |
(c) Estimating Corridor Casualty Expectation
(1) A corridor casualty expectation [EC(Corridor)] estimate is the sum of the expected casualty measurement of each populated area inside a flight corridor.
(2) An applicant shall identify and locate each populated area in the proposed flight corridor.
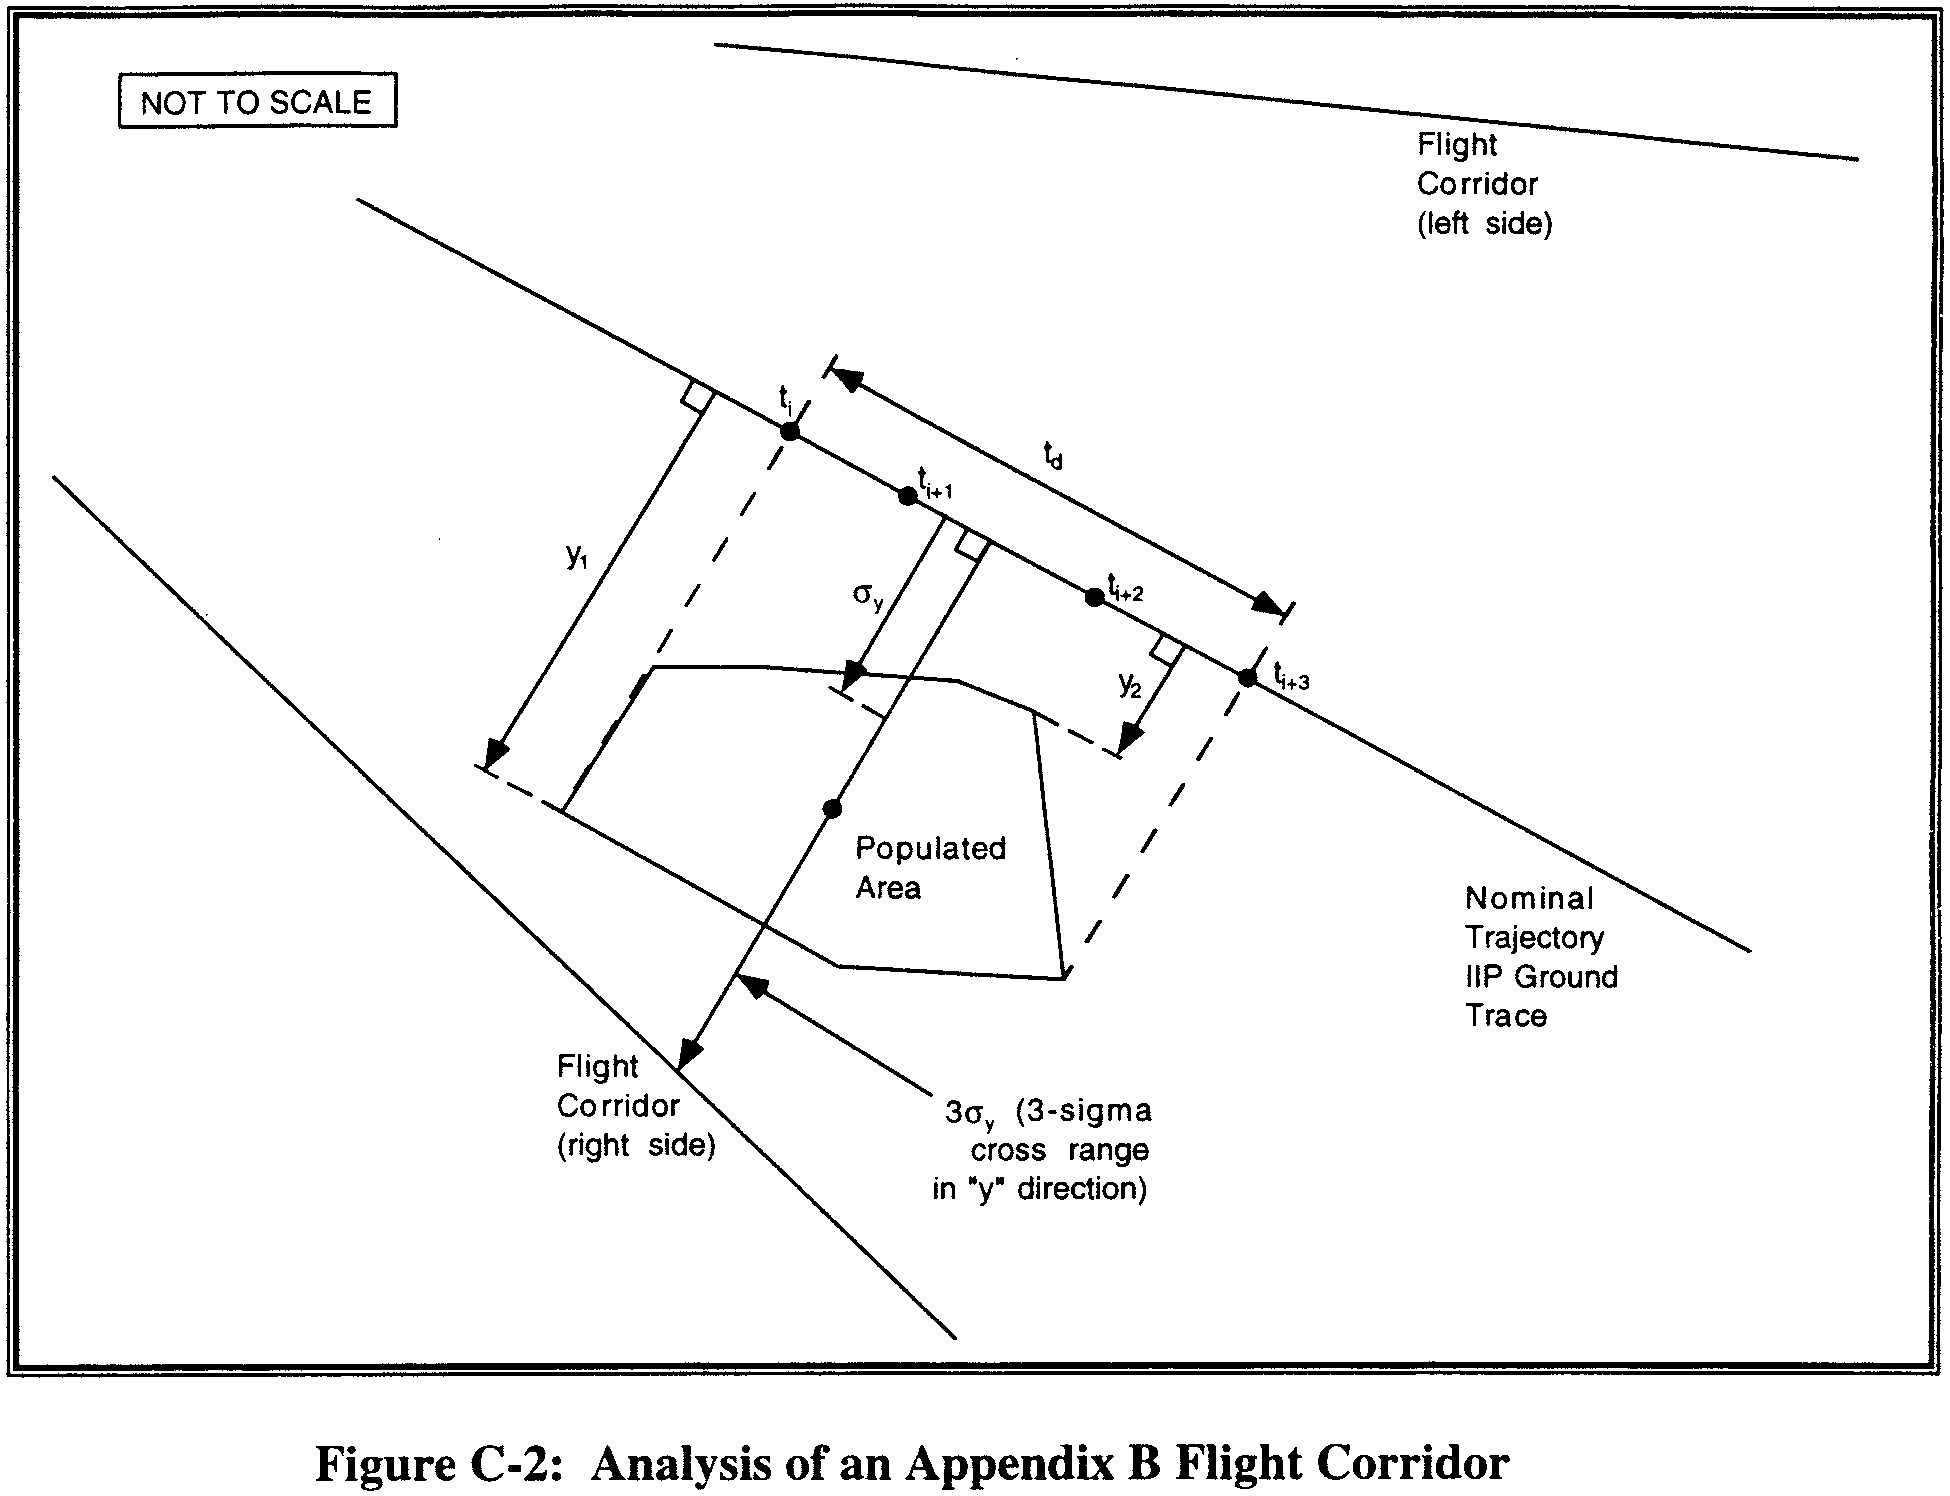
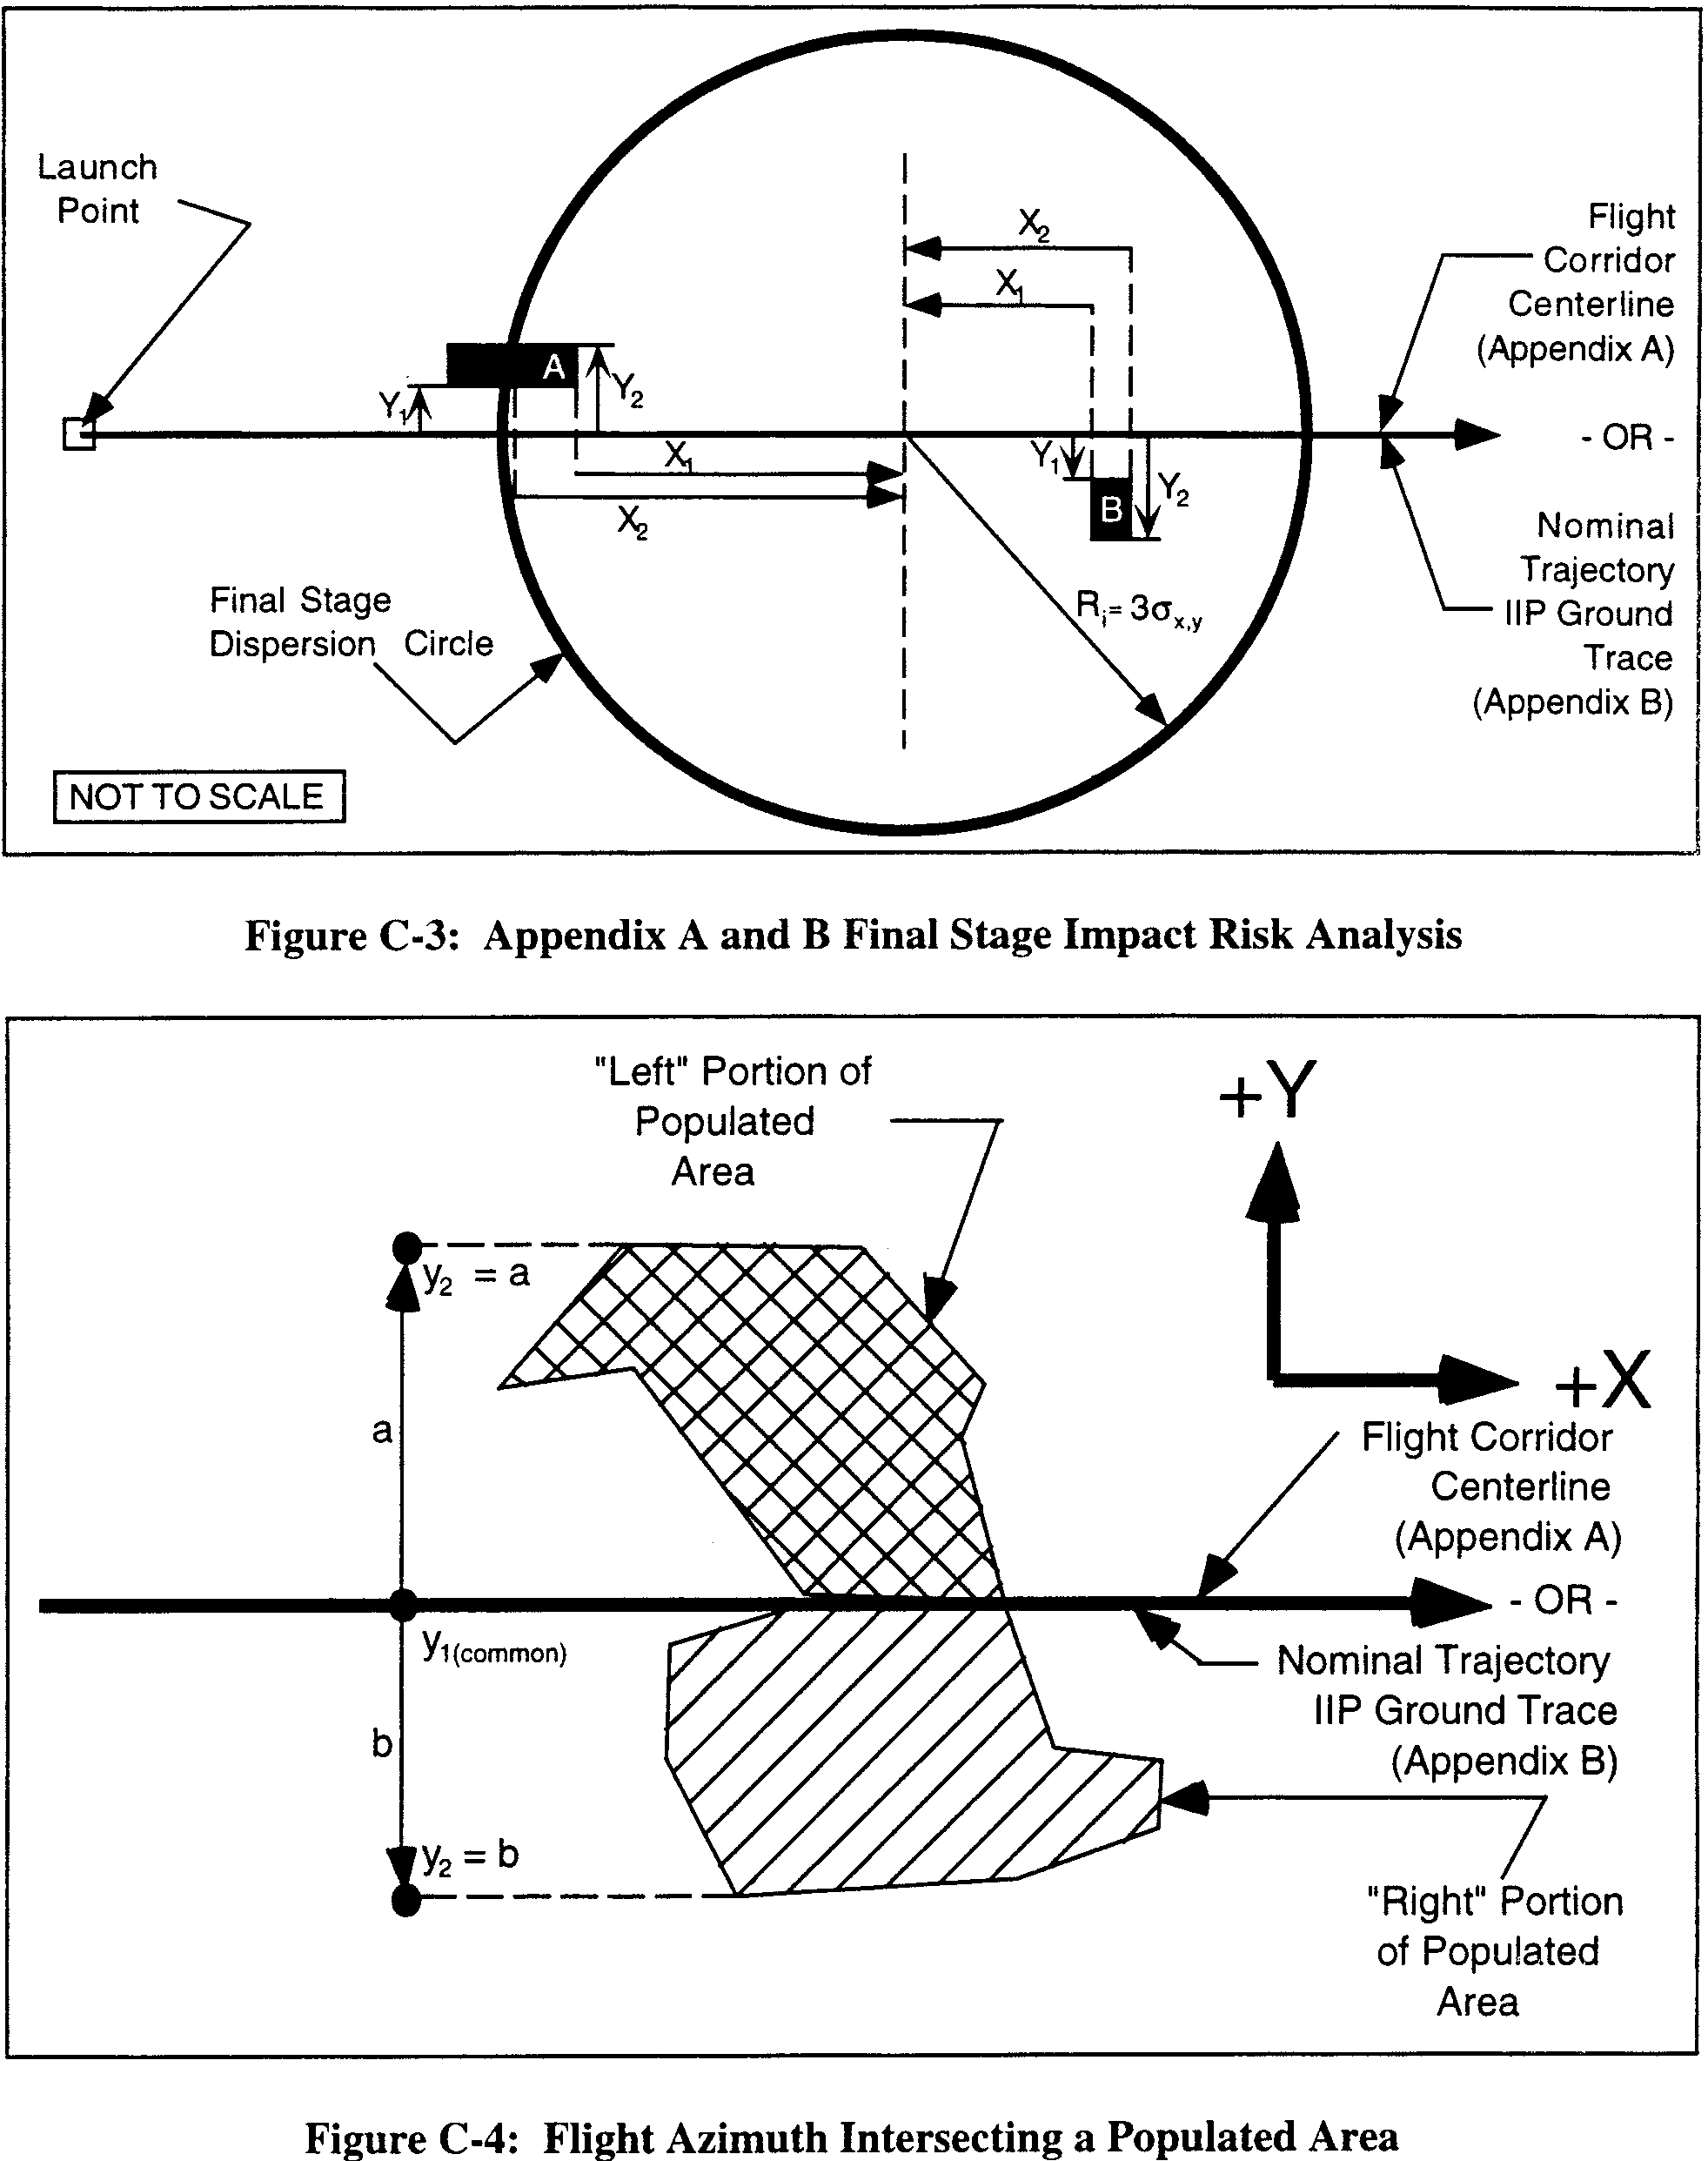
(3) An applicant shall determine the probability of impact in each populated area using the procedures in subparagraphs (5) or (6) of this paragraph. Figures C-1 and C-2 illustrate an area considered for probability of impact (Pi) computations by the dashed-lined box around the populated area within a flight corridor, and figure C-3 illustrates a populated area in a final stage impact dispersion area. An applicant shall then estimate the EC for each populated area in accordance with subparagraphs (7) and (8) of this paragraph.
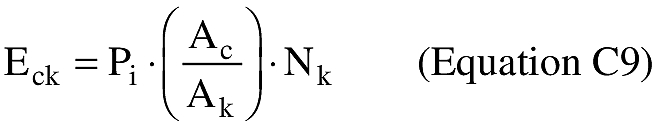
(4) The Pi computations do not directly account for populated areas whose areas are bisected by an appendix A flight corridor centerline or an appendix B nominal trajectory ground trace. Accordingly, an applicant must evaluate Pi for each of the bi-sections as two separate populated areas, as shown in figure C-4, which shows one bi-section to the left of an appendix A flight corridor's centerline and one to its right.
(5) Probability of impact (Pi) computations for a populated area in an appendix A flight corridor. An applicant shall compute Pi for each populated area using the following method:
(i) For the launch and downrange areas, but not for a final stage impact dispersion area for a guided suborbital launch vehicle, an applicant shall compute Pi for each populated area using the following equation:
where:
x1, x2 = closest and farthest downrange distance (nm) along the flight corridor centerline to the populated area (see figure C-1)
y1, y2 = closest and farthest cross range distance (nm) to the populated area measured from the flight corridor centerline (see figure C-1)
σy = one-third of the cross range distance from the centerline to the flight corridor boundary (see figure C-1)
exp = exponential function (e x)
Pf = probability of failure = 0.10
R = IIP range rate (nm/sec) (see table C-2)
C = 643 seconds (constant)
Table C-2—IIP Range Rate vs. IIP Range
IIP range(nm) | IIP range rate(nm/s) |
|---|---|
0-75 | 0.75 |
76-300 | 1.73 |
301-900 | 4.25 |
901-1700 | 8.85 |
1701-2600 | 19.75 |
2601-3500 | 42.45 |
3501-4500 | 84.85 |
4501-5250 | 154.95 |
(ii) For each populated area within a final stage impact dispersion area, an applicant shall compute Pi using the following method:
(A) An applicant shall estimate the probability of final stage impact in the x and y sectors of each populated area within the final stage impact dispersion area using equations C2 and C3:
where:
X1, X2 = closest and farthest downrange distance, measured along the flight corridor centerline, measured from the nominal impact point to the populated area (see figure C-3)
σx = one-third of the impact dispersion radius (see figure C-3)
exp = exponential function (e x)

where:
y1, y2 = closest and farthest cross range distance to the populated area measured from the flight corridor centerline (see figure C-3)
σy = one-third of the impact dispersion radius (see figure C-3)
exp = exponential function (e x)
(B) If a populated area intersects the impact dispersion area boundary so that the x2 or y2 distance would otherwise extend outside the impact dispersion area, the x2 or y2 distance should be set equal to the impact dispersion area radius. The x2 distance for populated area A in figure C-3 is an example. If a populated area intersects the flight azimuth, an applicant shall solve equation C3 by obtaining the solution in two parts. An applicant shall determine, first, the probability between y1 = 0 and y2 = a and, second, the probability between y1 = 0 and y2 = b, as depicted in figure C-4. The probability Py is then equal to the sum of the probabilities of the two parts. If a populated area intersects the line that is normal to the flight azimuth on the impact point, an applicant shall solve equation C2 by obtaining the solution in two parts in the same manner as with the values of x.
(C) An applicant shall calculate the probability of impact for each populated area using equation C4 below:

where: Ps = 1−Pf = 0.90
(6) Probability of impact computations for a populated area in an appendix B flight corridor. An applicant shall compute Pi using the following method:
(i) For the launch and downrange areas, but not for a final stage impact dispersion area for a guided suborbital launch vehicle, an applicant shall compute Pi for each populated area using the following equation:
where:
y1,y2 = closest and farthest cross range distance (nm) to a populated area measured from the nominal trajectory IIP ground trace (see figure C-2)
σy = one-third of the cross range distance (nm) from nominal trajectory to the flight corridor boundary (see figure C-2)
exp = exponential function (ex)
Pf = probability of failure = 0.10
t = flight time from lift-off to orbital insertion (seconds)
td = overflight dwell time (seconds)
(ii) For each populated area within a final stage impact dispersion area, an applicant shall compute Pi using the following method:
(A) An applicant shall estimate the probability of final stage impact in the x and y sectors of each populated area within the final stage impact dispersion area using equations C6 and C7:

where:
x1, x2 = closest and farthest downrange distance, measured along nominal trajectory IIP ground trace, measured from the nominal impact point to the populated area (see figure C-3)
σx = one-third of the impact dispersion radius (see figure C-3)
exp = exponential function (ex)
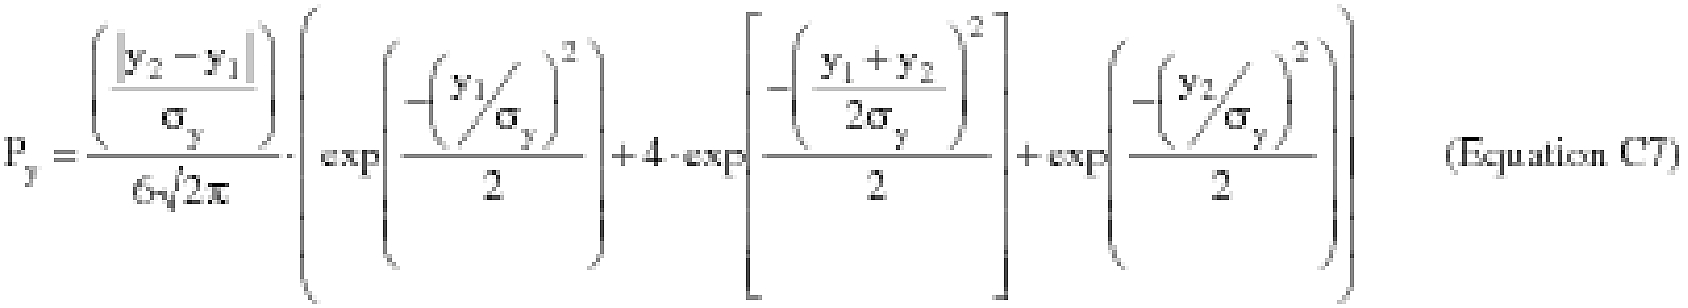
where:
y1, y2 = closest and farthest cross range distance to the populated area measured from the nominal trajectory IIP ground trace (see figure C-3)
σy = one-third of the impact dispersion radius (see figure C-3)
exp = exponential function (ex)
(B) If a populated area intersects the impact dispersion area boundary so that the x2 or y2 distance would otherwise extend outside the impact dispersion area, the x2 or y2 distance should be set equal to the impact dispersion area radius. The x2 distance for populated area A in figure C-3 is an example. If a populated area intersects the flight azimuth, an applicant shall solve equation C7 by obtaining the solution in two parts. An applicant shall determine, first, the probability between y1 = 0 and y2 = a and, second, the probability between y1 = 0 and y2 = b, as depicted in figure C-4. The probability Py is then equal to the sum of the probabilities of the two parts. If a populated area intersects the line that is normal to the flight azimuth on the impact point, an applicant shall solve equation C6 by obtaining the solution in two parts in a similar manner with the values of x.
(C) An applicant shall calculate the probability of impact for each populated area using equation C8 below:

where: Ps = 1−Pf = 0.90
(7) Using the Pi calculated in either subparagraph (c)(5) or (6) of this paragraph, an applicant shall calculate the casualty expectancy for each populated area within the flight corridor in accordance with equation C9. Eck is the casualty expectancy for a given populated area as shown in equation C9, where individual populated areas are designated with the subscript “k”.
where:
Ac = casualty area (from table C-3)
Ak = populated area
Nk = population in Ak
Table C-3—Effective Casualty Area (Miles 2) as a Function of IIP Range (NM)
Orbital launch vehicles | Suborbital launchvehicles | ||||
|---|---|---|---|---|---|
Instantaneous impact point range (nautical miles) | Small | Medium | Medium large | Large | Guided |
0-49 | 3.14 × 10⁻² | 1.28 × 10⁻¹ | 4.71 × 10⁻² | 8.59 × 10⁻² | 4.3 × 10⁻¹ |
50-1749 | 2.47 × 10⁻² | 2.98 × 10⁻² | 9.82 × 10⁻³ | 2.45 × 10⁻² | 1.3 × 10⁻¹ |
1750-5000 | 3.01 × 10⁻⁴ | 5.52 × 10⁻³ | 7.82 × 10⁻³ | 1.14 × 10⁻² | 3.59 × 10⁻⁶ |
(8) An applicant shall estimate the total corridor risk using the following summation of risk:
(9) Alternative casualty expectancy (EC) analyses. An applicant may employ specified variations to the analysis defined by subparagraphs (c)(1)-(8). Those variations are identified in subparagraphs (9)(i) through (vi) of this paragraph. Subparagraphs (i) through (iv) permit an applicant to make conservative assumptions that would lead to an overestimation of the corridor EC compared with the analysis defined by subparagraphs (c)(1)-(8). In subparagraphs (v) and (vi), an applicant that would otherwise fail the analysis prescribed by subparagraphs (c)(1)-(8) may avoid (c)(1)-(8)'s overestimation of the probability of impact in each populated area. An applicant employing a variation shall identify the variation used, show and discuss the specific assumptions made to modify the analysis defined by subparagraphs (c)(1)-(8), and demonstrate how each assumption leads to overestimation of the corridor EC compared with the analysis defined by subparagraphs (c)(1)-(c)(8).
(i) Assume that Px and Py have a value of 1.0 for all populated areas.
(ii) Combine populated areas into one or more larger populated areas, and use a population density for the combined area or areas equal to the most densely populated area.
(iii) For any given populated area, assume Py has a value of one.
(iv) For any given Px sector (an area spanning the width of a flight corridor and bounded by two time points on the trajectory IIP ground trace) assume Py has a value of one and use a population density for the sector equal to the most densely populated area.
(v) For a given populated area, divide the populated area into smaller rectangles, determine Pi for each individual rectangle, and sum the individual impact probabilities to determine Pi for the entire populated area.
(vi) For a given populated area, use the ratio of the populated area to the area of the Pi rectangle from the subparagraph (c)(1)-(8) analysis.
(d) Evaluation of Results
(1) If the estimated expected casualty does not exceed 1 × 10⁻⁴, the FAA will approve the launch site location.
(2) If the estimated expected casualty exceeds 1 × 10⁻⁴, then an applicant may either modify its proposal, or, if the flight corridor used was generated by the appendix A method, use the appendix B method to narrow the flight corridor and then perform another appendix C risk analysis.
[Doc. No. FAA-1999-5833, 65 FR 62861, Oct. 19, 2000, as amended by Amdt. 420-2, 71 FR 51972, Aug. 31, 2006; Docket No. FAA-2014-0418, Amdt. No. 420-7, 81 FR 47027, July 20, 2016]