Pt. 33, App. B
Appendix B to Part 33—Certification Standard Atmospheric Concentrations of Rain and Hail
Figure B1, Table B1, Table B2, Table B3, and Table B4 specify the atmospheric concentrations and size distributions of rain and hail for establishing certification, in accordance with the requirements of § 33.78(a)(2). In conducting tests, normally by spraying liquid water to simulate rain conditions and by delivering hail fabricated from ice to simulate hail conditions, the use of water droplets and hail having shapes, sizes and distributions of sizes other than those defined in this appendix B, or the use of a single size or shape for each water droplet or hail, can be accepted, provided that applicant shows that the substitution does not reduce the severity of the test.
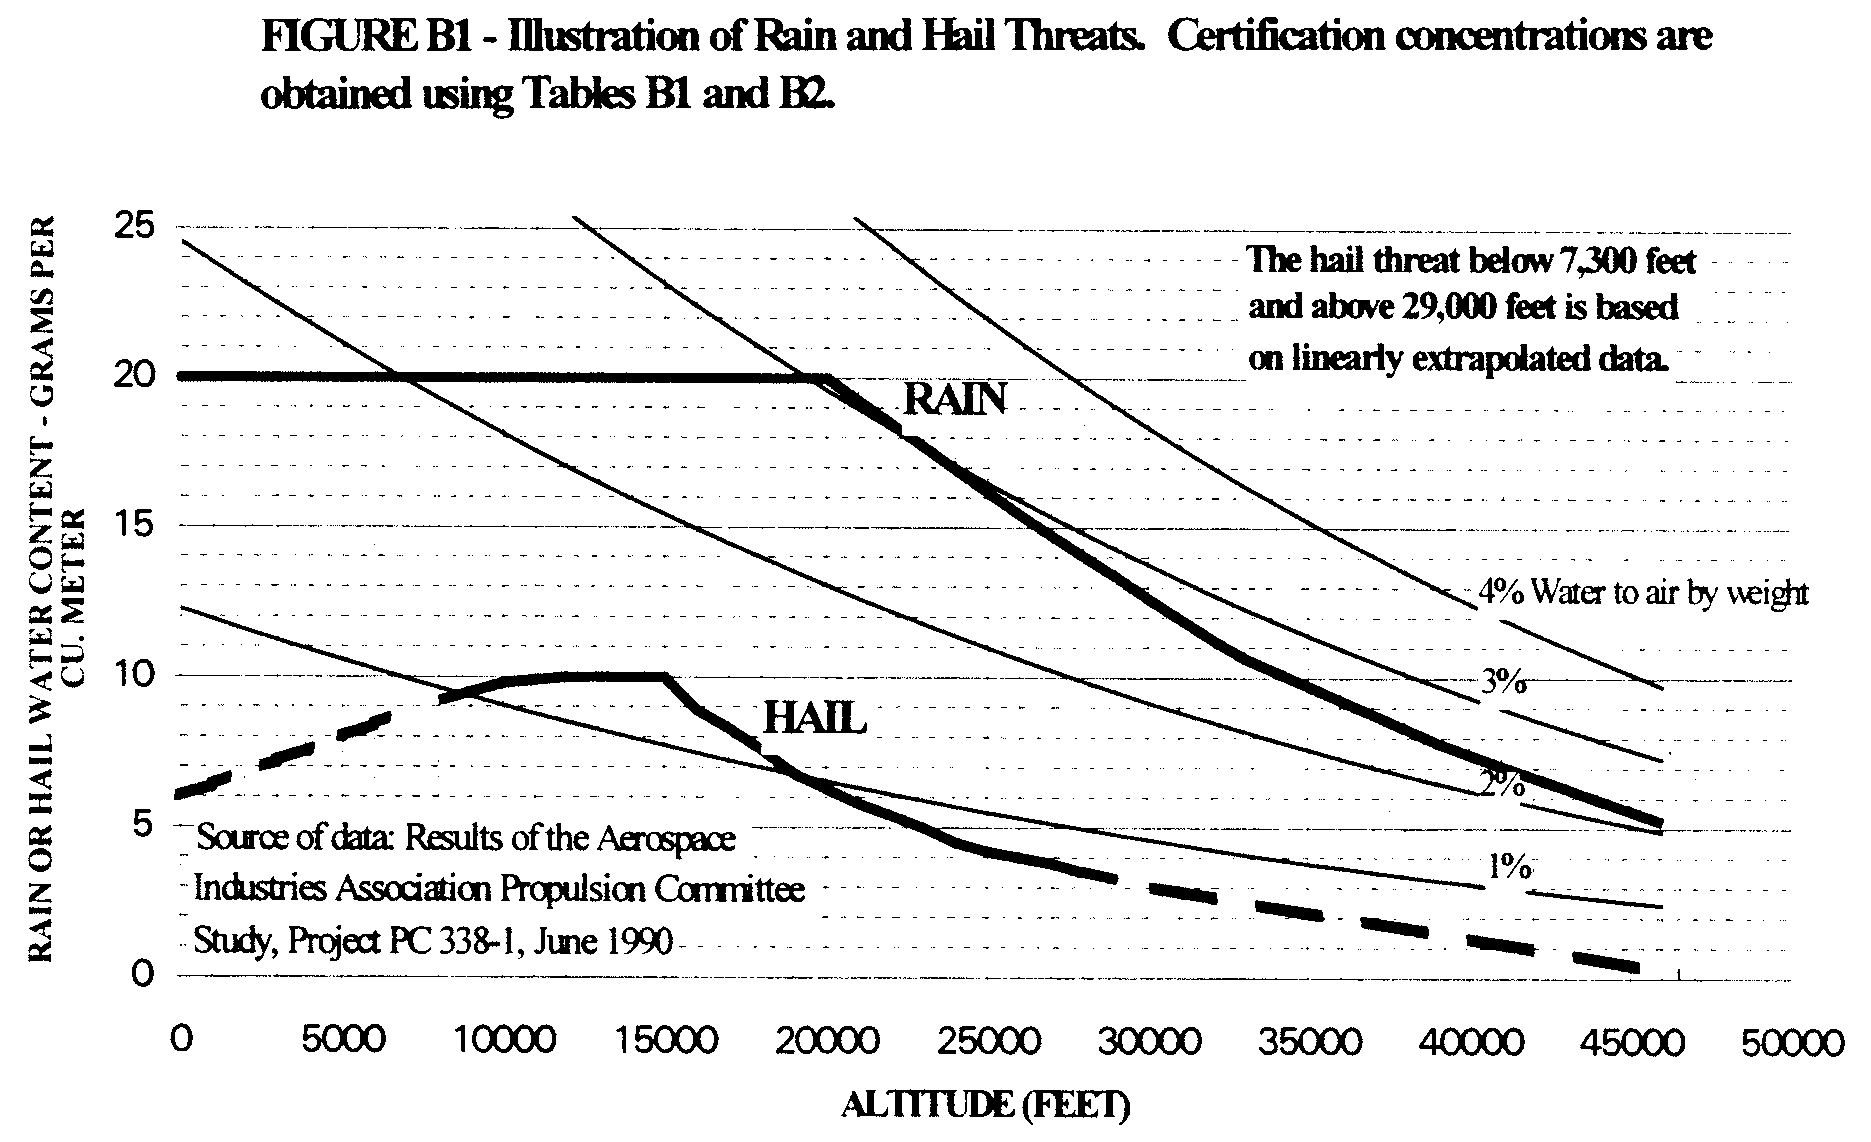
Table B1—Certification Standard Atmospheric Rain Concentrations
Altitude (feet) | Rain water content (RWC)(grams water/meter 3 air) |
|---|---|
0 | 20.0 |
20,000 | 20.0 |
26,300 | 15.2 |
32,700 | 10.8 |
39,300 | 7.7 |
46,000 | 5.2 |
RWC values at other altitudes may be determined by linear interpolation. | |
Note: Source of data—Results of the Aerospace Industries Association (AIA) Propulsion Committee Study, Project PC 338-1, June 1990. | |
Table B2—Certification Standard Atmospheric Hail Concentrations
Altitude (feet) | Hail water content (HWC)(grams water/meter 3 air) |
|---|---|
0 | 6.0 |
7,300 | 8.9 |
8,500 | 9.4 |
10,000 | 9.9 |
12,000 | 10.0 |
15,000 | 10.0 |
16,000 | 8.9 |
17,700 | 7.8 |
19,300 | 6.6 |
21,500 | 5.6 |
24,300 | 4.4 |
29,000 | 3.3 |
46,000 | 0.2 |
HWC values at other altitudes may be determined by linear interpolation. The hail threat below 7,300 feet and above 29,000 feet is based on linearly extrapolated data. | |
Note: Source of data—Results of the Aerospace Industries Association (AIA Propulsion Committee (PC) Study, Project PC 338-1, June 1990. | |
Table B3—Certification Standard Atmospheric Rain Droplet Size Distribution
Rain droplet diameter (mm) | Contribution total RWC (%) |
|---|---|
0-0.49 | 0 |
0.50-0.99 | 2.25 |
1.00-1.49 | 8.75 |
1.50-1.99 | 16.25 |
2.00-2.49 | 19.00 |
2.50-2.99 | 17.75 |
3.00-3.49 | 13.50 |
3.50-3.99 | 9.50 |
4.00-4.49 | 6.00 |
4.50-4.99 | 3.00 |
5.00-5.49 | 2.00 |
5.50-5.99 | 1.25 |
6.00-6.49 | 0.50 |
6.50-7.00 | 0.25 |
Total | 100.00 |
Median diameter of rain droplets in 2.66 mm | |
Note: Source of data—Results of the Aerospace Industries Association (AIA Propulsion Committee (PC) Study, Project PC 338-1, June 1990. | |
Table B4—Certification Standard Atmospheric Hail Size Distribution
Hail diameter (mm) | Contribution total HWC (%) |
|---|---|
0-4.9 | 0 |
5.0-9.9 | 17.00 |
10.0-14.9 | 25.00 |
15.0-19.9 | 22.50 |
20.0-24.9 | 16.00 |
25.0-29.9 | 9.75 |
30.0-34.9 | 4.75 |
35.0-39.9 | 2.50 |
40.0-44.9 | 1.50 |
45.0-49.9 | 0.75 |
50.0-55.0 | 0.25 |
Total | 100.00 |
Median diameter of hail is 16 mm | |
Note: Source of data—Results of the Aerospace Industries Association (AIA Propulsion Committee (PC) Study, Project PC 338-1, June 1990. | |
[Doc. No. 28652, 63 FR 14799, Mar. 26, 1998]