Pt. 36, App. A
Appendix A to Part 36—Aircraft Noise Measurement and Evaluation Under § 36.101
Sec.
A36.1 Introduction.
A36.2 Noise Certification Test and Measurement Conditions.
A36.3 Measurement of Airplane Noise Received on the Ground.
A36.4 Calculations of Effective Perceived Noise Level From Measured Data.
A36.5 Reporting of Data to the FAA.
A36.6 Nomenclature: Symbols and Units.
A36.7 Sound Attenuation in Air.
A36.8 [Reserved]
A36.9 Adjustment of Airplane Flight Test Results.
Section A36.1 Introduction
A36.1.1 This appendix prescribes the conditions under which airplane noise certification tests must be conducted and states the measurement procedures that must be used to measure airplane noise. The procedures that must be used to determine the noise evaluation quantity designated as effective perceived noise level, EPNL, under §§ 36.101 and 36.803 are also stated.
A36.1.2 The instructions and procedures given are intended to ensure uniformity during compliance tests and to permit comparison between tests of various types of airplanes conducted in various geographical locations.
A36.1.3 A complete list of symbols and units, the mathematical formulation of perceived noisiness, a procedure for determining atmospheric attenuation of sound, and detailed procedures for correcting noise levels from non-reference to reference conditions are included in this appendix.
A36.1.4 For Stage 4 airplanes, an acceptable alternative for noise measurement and evaluation is Appendix 2 to ICAO Annex 16, Volume I, Amendment 7 (incorporated by reference, see § 36.6).
A36.1.5 For Stage 5 airplanes, an acceptable alternative for noise measurement and evaluation is Appendix 2 to ICAO Annex 16, Volume 1, Amendment 11-B (incorporated by reference, see § 36.6).
Section A36.2 Noise Certification Test and Measurement Conditions
A36.2.1 General.
A36.2.1.1 This section prescribes the conditions under which noise certification must be conducted and the measurement procedures that must be used.
Note:
Many noise certifications involve only minor changes to the airplane type design. The resulting changes in noise can often be established reliably without resorting to a complete test as outlined in this appendix. For this reason, the FAA permits the use of approved equivalent procedures. There are also equivalent procedures that may be used in full certification tests, in the interest of reducing costs and providing reliable results. Guidance material on the use of equivalent procedures in the noise certification of subsonic jet and propeller-driven large airplanes is provided in the current advisory circular for this part.
A36.2.2 Test environment.
A36.2.2.1 Locations for measuring noise from an airplane in flight must be surrounded by relatively flat terrain having no excessive sound absorption characteristics such as might be caused by thick, matted, or tall grass, shrubs, or wooded areas. No obstructions that significantly influence the sound field from the airplane must exist within a conical space above the point on the ground vertically below the microphone, the cone being defined by an axis normal to the ground and by a half-angle 80° from this axis.
Note:
Those people carrying out the measurements could themselves constitute such obstruction.
A36.2.2.2 The tests must be carried out under the following atmospheric conditions.
(a) No precipitation;
(b) Ambient air temperature not above 95 °F (35 °C) and not below 14 °F (−10 °C), and relative humidity not above 95% and not below 20% over the whole noise path between a point 33 ft (10 m) above the ground and the airplane;
Note:
Care should be taken to ensure that the noise measuring, airplane flight path tracking, and meteorological instrumentation are also operated within their specific environmental limitations.
(c) Relative humidity and ambient temperature over the whole noise path between a point 33 ft (10 m) above the ground and the airplane such that the sound attenuation in the one-third octave band centered on 8 kHz will not be more than 12 dB/100 m unless:
(1) The dew point and dry bulb temperatures are measured with a device which is accurate to ±0.9 °F (±0.5 °C) and used to obtain relative humidity; in addition layered sections of the atmosphere are used as described in section A36.2.2.3 to compute equivalent weighted sound attenuations in each one-third octave band; or
(2) The peak noy values at the time of PNLT, after adjustment to reference conditions, occur at frequencies less than or equal to 400 Hz.;
(d) If the atmospheric absorption coefficients vary over the PNLTM sound propagation path by more than ±1.6 dB/1000 ft (±0.5 dB/100m) in the 3150Hz one-third octave band from the value of the absorption coefficient derived from the meteorological measurement obtained at 33 ft (10 m) above the surface, “layered” sections of the atmosphere must be used as described in section A36.2.2.3 to compute equivalent weighted sound attenuations in each one-third octave band; the FAA will determine whether a sufficient number of layered sections have been used. For each measurement, where multiple layering is not required, equivalent sound attenuations in each one-third octave band must be determined by averaging the atmospheric absorption coefficients for each such band at 33 ft (10 m) above ground level, and at the flight level of the airplane at the time of PNLTM, for each measurement;
(e) Average wind velocity 33 ft (10 m) above ground may not exceed 12 knots and the crosswind velocity for the airplane may not exceed 7 knots. The average wind velocity must be determined using a 30-second averaging period spanning the 10 dB-down time interval. Maximum wind velocity 33 ft (10 m) above ground is not to exceed 15 knots and the crosswind velocity is not to exceed 10 knots during the 10 dB-down time interval;
(f) No anomalous meteorological or wind conditions that would significantly affect the measured noise levels when the noise is recorded at the measuring points specified by the FAA; and
(g) Meteorological measurements must be obtained within 30 minutes of each noise test measurement; meteorological data must be interpolated to actual times of each noise measurement.
A36.2.2.3 When a multiple layering calculation is required by section A36.2.2.2(c) or A36.2.2.2(d) the atmosphere between the airplane and 33 ft (10 m) above the ground must be divided into layers of equal depth. The depth of the layers must be set to not more than the depth of the narrowest layer across which the variation in the atmospheric absorption coefficient of the 3150 Hz one-third octave band is not greater than ±1.6 dB/1000 ft (±0.5 dB/100m), with a minimum layer depth of 100 ft (30 m). This requirement must be met for the propagation path at PNLTM. The mean of the values of the atmospheric absorption coefficients at the top and bottom of each layer may be used to characterize the absorption properties of each layer.
A36.2.2.4 The airport control tower or another facility must be aproved by the FAA for use as the central location at which measurements of atmospheric parameters are representative of those conditions existing over the geographical area in which noise measurements are made.
A36.2.3 Flight path measurement.
A36.2.3.1 The airplane height and lateral position relative to the flight track must be determined by a method independent of normal flight instrumentation such as radar tracking, theodolite triangulation, or photographic scaling techniques, to be approved by the FAA.
A36.2.3.2 The airplane position along the flight path must be related to the noise recorded at the noise measurement locations by means of synchronizing signals over a distance sufficient to assure adequate data during the period that the noise is within 10 dB of the maximum value of PNLT.
A36.2.3.3 Position and performance data required to make the adjustments referred to in section A36.9 of this appendix must be automatically recorded at an approved sampling rate. Measuring equipment must be approved by the FAA.
Section A36.3 Measurement of Airplane Noise Received on the Ground
A36.3.1 Definitions.
For the purposes of section A36.3 the following definitions apply:
A36.3.1.1 Measurement system means the combination of instruments used for the measurement of sound pressure levels, including a sound calibrator, windscreen, microphone system, signal recording and conditioning devices, and one-third octave band analysis system.
Note:
Practical installations may include a number of microphone systems, the outputs from which are recorded simultaneously by a multi-channel recording/analysis device via signal conditioners, as appropriate. For the purpose of this section, each complete measurement channel is considered to be a measurement system to which the requirements apply accordingly.
A36.3.1.2 Microphone system means the components of the measurement system which produce an electrical output signal in response to a sound pressure input signal, and which generally include a microphone, a preamplifier, extension cables, and other devices as necessary.
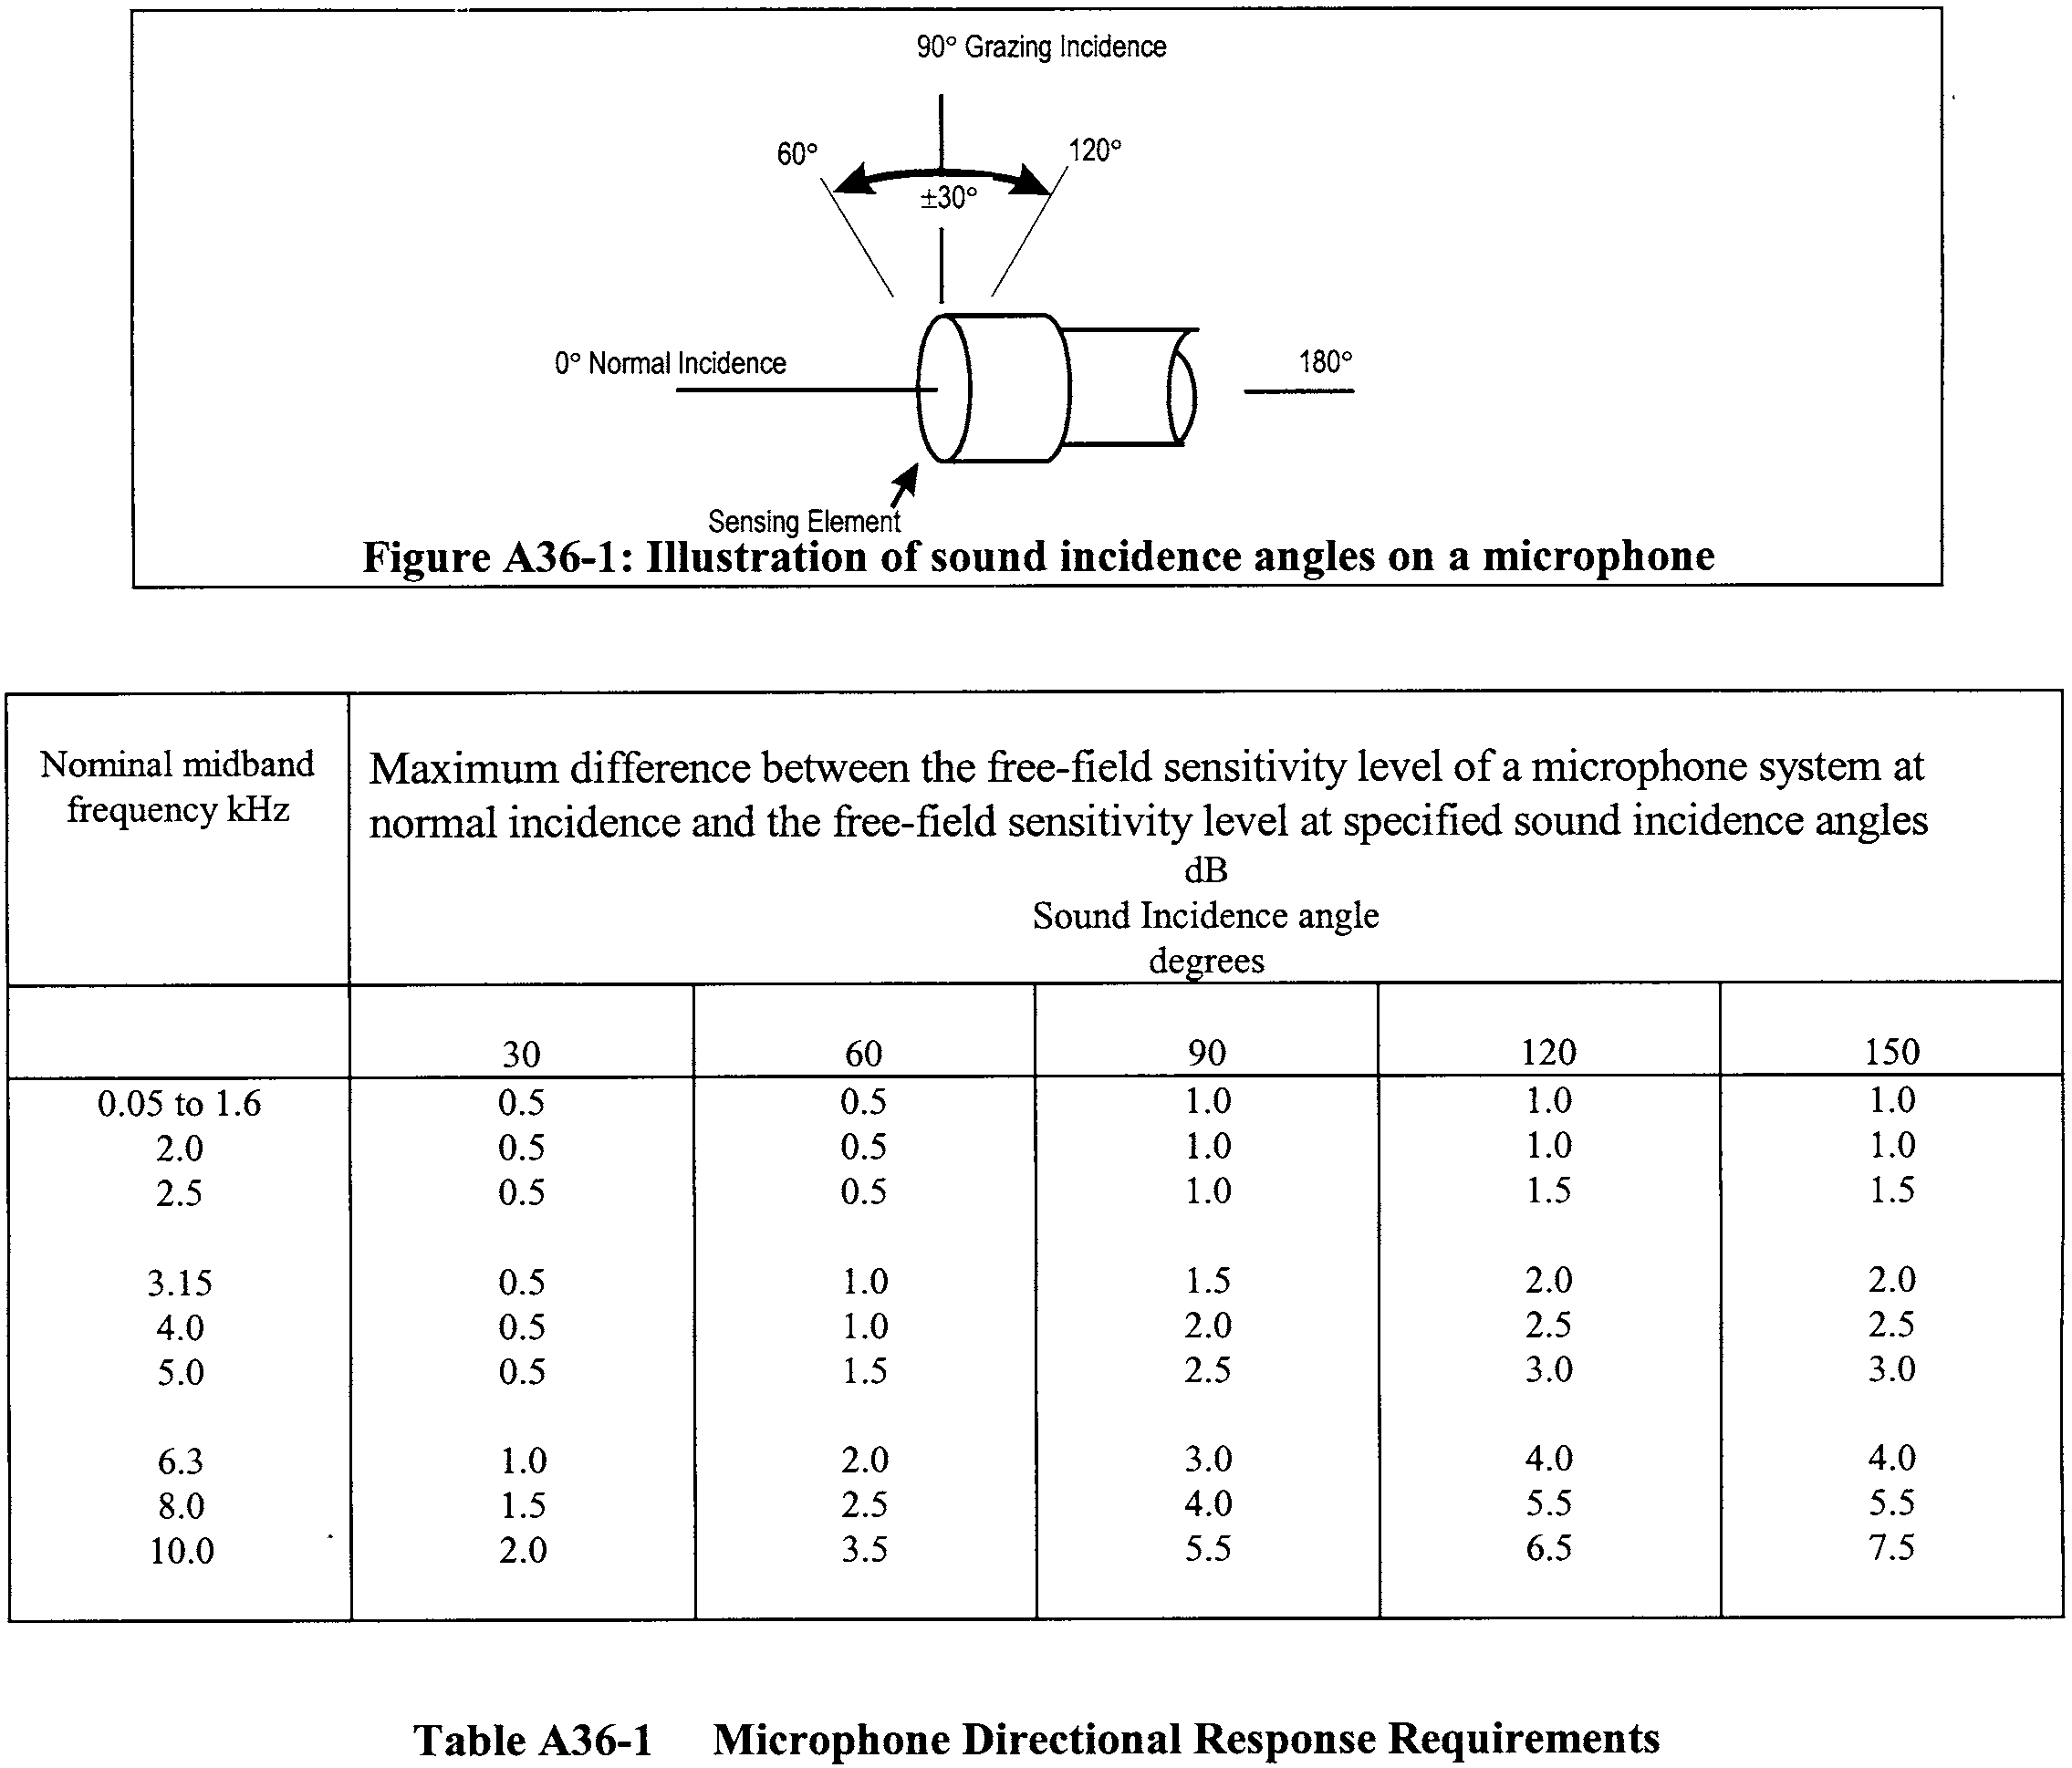
A36.3.1.3 Sound incidence angle means in degrees, an angle between the principal axis of the microphone, as defined in IEC 61094-3 and IEC 61094-4, as amended and a line from the sound source to the center of the diaphragm of the microphone (incorporated by reference, see § 36.6).
Note:
When the sound incidence angle is 0°, the sound is said to be received at the microphone at “normal (perpendicular) incidence;” when the sound incidence angle is 90°, the sound is said to be received at “grazing incidence.”
A36.3.1.4 Reference direction means, in degrees, the direction of sound incidence specified by the manufacturer of the microphone, relative to a sound incidence angle of 0°, for which the free-field sensitivity level of the microphone system is within specified tolerance limits.
A36.3.1.5 Free-field sensitivity of a microphone system means, in volts per Pascal, for a sinusoidal plane progressive sound wave of specified frequency, at a specified sound incidence angle, the quotient of the root mean square voltage at the output of a microphone system and the root mean square sound pressure that would exist at the position of the microphone in its absence.
A36.3.1.6 Free-field sensitivity level of a microphone system means, in decibels, twenty times the logarithm to the base ten of the ratio of the free-field sensitivity of a microphone system and the reference sensitivity of one volt per Pascal.
Note:
The free-field sensitivity level of a microphone system may be determined by subtracting the sound pressure level (in decibels re 20 µPa) of the sound incident on the microphone from the voltage level (in decibels re 1 V) at the output of the microphone system, and adding 93.98 dB to the result.
A36.3.1.7 Time-average band sound pressure level means in decibels, ten times the logarithm to the base ten, of the ratio of the time mean square of the instantaneous sound pressure during a stated time interval and in a specified one-third octave band, to the square of the reference sound pressure of 20 µPa.
A36.3.1.8 Level range means, in decibels, an operating range determined by the setting of the controls that are provided in a measurement system for the recording and one-third octave band analysis of a sound pressure signal. The upper boundary associated with any particular level range must be rounded to the nearest decibel.
A36.3.1.9 Calibration sound pressure level means, in decibels, the sound pressure level produced, under reference environmental conditions, in the cavity of the coupler of the sound calibrator that is used to determine the overall acoustical sensitivity of a measurement system.
A36.3.1.10 Reference level range means, in decibels, the level range for determining the acoustical sensitivity of the measurement system and containing the calibration sound pressure level.
A36.3.1.11 Calibration check frequency means, in hertz, the nominal frequency of the sinusoidal sound pressure signal produced by the sound calibrator.
A36.3.1.12 Level difference means, in decibels, for any nominal one-third octave midband frequency, the output signal level measured on any level range minus the level of the corresponding electrical input signal.
A36.3.1.13 Reference level difference means, in decibels, for a stated frequency, the level difference measured on a level range for an electrical input signal corresponding to the calibration sound pressure level, adjusted as appropriate, for the level range.
A36.3.1.14 Level non-linearity means, in decibels, the level difference measured on any level range, at a stated one-third octave nominal midband frequency, minus the corresponding reference level difference, all input and output signals being relative to the same reference quantity.
A36.3.1.15 Linear operating range means, in decibels, for a stated level range and frequency, the range of levels of steady sinusoidal electrical signals applied to the input of the entire measurement system, exclusive of the microphone but including the microphone preamplifier and any other signal-conditioning elements that are considered to be part of the microphone system, extending from a lower to an upper boundary, over which the level non-linearity is within specified tolerance limits.
Note:
Microphone extension cables as configured in the field need not be included for the linear operating range determination.
A36.3.1.16 Windscreen insertion loss means, in decibels, at a stated nominal one-third octave midband frequency, and for a stated sound incidence angle on the inserted microphone, the indicated sound pressure level without the windscreen installed around the microphone minus the sound pressure level with the windscreen installed.
A36.3.2 Reference environmental conditions.
A36.3.2.1 The reference environmental conditions for specifying the performance of a measurement system are:
(a) Air temperature 73.4 °F (23 °C);
(b) Static air pressure 101.325 kPa; and
(c) Relative humidity 50%.
A36.3.3. General.
Note:
Measurements of aircraft noise that are made using instruments that conform to the specifications of this section will yield one-third octave band sound pressure levels as a function of time. These one-third octave band levels are to be used for the calculation of effective perceived noise level as described in section A36.4.
A36.3.3.1 The measurement system must consist of equipment approved by the FAA and equivalent to the following:
(a) A windscreen (See A36.3.4.);
(b) A microphone system (See A36.3.5):
(c) A recording and reproducing system to store the measured aircraft noise signals for subsequent analysis (see A36.3.6);
(d) A one-third octave band analysis system (see A36.3.7); and
(e) Calibration systems to maintain the acoustical sensitivity of the above systems within specified tolerance limits (see A36.3.8).
A36.3.3.2. For any component of the measurement system that converts an analog signal to digital form, such conversion must be performed so that the levels of any possible aliases or artifacts of the digitization process will be less than the upper boundary of the linear operating range by at least 50 dB at any frequency less than 12.5 kHz. The sampling rate must be at least 28 kHz. An anti-aliasing filter must be included before the digitization process.
A36.3.4 Windscreen.
A36.3.4.1 In the absence of wind and for sinusoidal sounds at grazing incidence, the insertion loss caused by the windscreen of a stated type installed around the microphone must not exceed ±1.5 dB at nominal one-third octave midband frequencies from 50 Hz to 10 kHz inclusive.
A36.3.5 Microphone system.
A36.3.5.1 The microphone system must meet the specifications in sections A36.3.5.2 to A36.3.5.4. Various microphone systems may be approved by the FAA on the basis of demonstrated equivalent overall electroacoustical performance. Where two or more microphone systems of the same type are used, demonstration that at least one system conforms to the specifications in full is sufficient to demonstrate conformance.
Note:
An applicant must still calibrate and check each system as required in section A36.3.9.
A36.3.5.2 The microphone must be mounted with the sensing element 4 ft (1.2 m) above the local ground surface and must be oriented for grazing incidence, i.e., with the sensing element substantially in the plane defined by the predicted reference flight path of the aircraft and the measuring station. The microphone mounting arrangement must minimize the interference of the supports with the sound to be measured. Figure A36-1 illustrates sound incidence angles on a microphone.
A36.3.5.3 The free-field sensitivity level of the microphone and preamplifier in the reference direction, at frequencies over at least the range of one-third-octave nominal midband frequencies from 50 Hz to 5 kHz inclusive, must be within ±1.0 dB of that at the calibration check frequency, and within ±2.0 dB for nominal midband frequencies of 6.3 kHz, 8 kHz and 10 kHz.
A36.3.5.4 For sinusoidal sound waves at each one-third octave nominal midband frequency over the range from 50 Hz to 10 kHz inclusive, the free-field sensitivity levels of the microphone system at sound incidence angles of 30°, 60°, 90°, 120° and 150°, must not differ from the free-field sensitivity level at a sound incidence angle of 0° (“normal incidence”) by more than the values shown in Table A36-1. The free-field sensitivity level differences at sound incidence angles between any two adjacent sound incidence angles in Table A36-1 must not exceed the tolerance limit for the greater angle.
A36.3.6 Recording and reproducing systems.
A36.3.6.1 A recording and reproducing system, such as a digital or analog magnetic tape recorder, a computer-based system or other permanent data storage device, must be used to store sound pressure signals for subsequent analysis. The sound produced by the aircraft must be recorded in such a way that a record of the complete acoustical signal is retained. The recording and reproducing systems must meet the specifications in sections A36.3.6.2 to A36.3.6.9 at the recording speeds and/or data sampling rates used for the noise certification tests. Conformance must be demonstrated for the frequency bandwidths and recording channels selected for the tests.
A36.3.6.2 The recording and reproducing systems must be calibrated as described in section A36.3.9.
(a) For aircraft noise signals for which the high frequency spectral levels decrease rapidly with increasing frequency, appropriate pre-emphasis and complementary de-emphasis networks may be included in the measurement system. If pre-emphasis is included, over the range of nominal one-third octave midband frequencies from 800 Hz to 10 kHz inclusive, the electrical gain provided by the pre-emphasis network must not exceed 20 dB relative to the gain at 800 Hz.
A36.3.6.3 For steady sinusoidal electrical signals applied to the input of the entire measurement system including all parts of the microphone system except the microphone at a selected signal level within 5 dB of that corresponding to the calibration sound pressure level on the reference level range, the time-average signal level indicated by the readout device at any one-third octave nominal midband frequency from 50 Hz to 10 kHz inclusive must be within ±1.5 dB of that at the calibration check frequency. The frequency response of a measurement system, which includes components that convert analog signals to digital form, must be within ±0.3 dB of the response at 10 kHz over the frequency range from 10 kHz to 11.2 kHz.
Note:
Microphone extension cables as configured in the field need not be included for the frequency response determination. This allowance does not eliminate the requirement of including microphone extension cables when performing the pink noise recording in section A36.3.9.5.
A36.3.6.4 For analog tape recordings, the amplitude fluctuations of a 1 kHz sinusoidal signal recorded within 5 dB of the level corresponding to the calibration sound pressure level must not vary by more than ±0.5 dB throughout any reel of the type of magnetic tape used. Conformance to this requirement must be demonstrated using a device that has time-averaging properties equivalent to those of the spectrum analyzer.
A36.3.6.5 For all appropriate level ranges and for steady sinusoidal electrical signals applied to the input of the measurement system, including all parts of the microphone system except the microphone, at one-third-octave nominal midband frequencies of 50 Hz, 1 kHz and 10 kHz, and the calibration check frequency, if it is not one of these frequencies, the level non-linearity must not exceed ±0.5 dB for a linear operating range of at least 50 dB below the upper boundary of the level range.
Note 1:
Level linearity of measurement system components may be tested according to the methods described in IEC 61265 as amended.
Note 2:
Microphone extension cables configured in the field need not be included for the level linearity determination.
A36.3.6.6 On the reference level range, the level corresonding to the calibration sound pressure level must be at least 5 dB, but no more than 30 dB less than the upper boundary of the level range.
A36.3.6.7 The linear operating ranges on adjacent level ranges must overlap by at least 50 dB minus the change in attenuation introduced by a change in the level range controls.
Note:
It is possible for a measurement system to have level range controls that permit attenuation changes of either 10 dB or 1 dB, for example. With 10 dB steps, the minimum overlap required would be 40 dB, and with 1 dB steps the minimum overlap would be 49 dB.
A36.3.6.8 An overload indicator must be included in the recording and reproducing systems so that an overload indication will occur during an overload condition on any relevant level range.
A36.3.6.9 Attenuators included in the measurement system to permit range changes must operate in known intervals of decibel steps.
A36.3.7 Analysis systems.
A36.3.7.1 The analysis system must conform to the specifications in sections A36.3.7.2 to A36.3.7.7 for the frequency bandwidths, channel configurations and gain settings used for analysis.
A36.3.7.2 The output of the analysis system must consist of one-third octave band sound pressure levels as a function of time, obtained by processing the noise signals (preferably recorded) through an analysis system with the following characteristics:
(a) A set of 24 one-third octave band filters, or their equivalent, having nominal midband frequencies from 50 Hz to 10 kHz inclusive;
(b) Response and averaging properties in which, in principle, the output from any one-third octave filter band is squared, averaged and displayed or stored as time-averaged sound pressure levels;
(c) The interval between successive sound pressure level samples must be 500 ms ±5 milliseconds(ms) for spectral analysis with or without slow time-weighting, as defined in section A36.3.7.4;
(d) For those analysis systems that do not process the sound pressure signals during the period of time required for readout and/or resetting of the analyzer, the loss of data must not exceed a duration of 5 ms; and
(e) The analysis system must operate in real time from 50 Hz through at least 12 kHz inclusive. This requirement applies to all operating channels of a multi-channel spectral analysis system.
A36.3.7.3 The minimum standard for the one-third octave band analysis system is the class 2 electrical performance requirements of IEC 61260 as amended, over the range of one-third octave nominal midband frequencies from 50 Hz through 10 kHz inclusive (incorporated by reference, see § 36.6).
Note:
IEC 61260 specifies procedures for testing of one-third octave band analysis systems for relative attenuation, anti-aliasing filters, real time operation, level linearity, and filter integrated response (effective bandwidth).
A36.3.7.4 When slow time averaging is performed in the analyzer, the response of the one-third octave band analysis system to a sudden onset or interruption of a constant sinusoidal signal at the respective one-third octave nominal midband frequency, must be measured at sampling instants 0.5, 1, 1.5 and 2 seconds(s) after the onset and 0.5 and 1s after interruption. The rising response must be −4 ±1 dB at 0.5s, −1.75 ±0.75 dB at 1s, −1 ±0.5 dB at 1.5s and −0.5 ±0.5 dB at 2s relative to the steady-state level. The falling response must be such that the sum of the output signal levels, relative to the initial steady-state level, and the corresponding rising response reading is −6.5 ±1 dB, at both 0.5 and 1s. At subsequent times the sum of the rising and falling responses must be −7.5 dB or less. This equates to an exponential averaging process (slow time-weighting) with a nominal 1s time constant (i.e., 2s averaging time).
A36.3.7.5 When the one-third octave band sound pressure levels are determined from the output of the analyzer without slow time-weighting, slow time-weighting must be simulated in the subsequent processing. Simulated slow time-weighted sound pressure levels can be obtained using a continuous exponential averaging process by the following equation:
Ls (i,k) = 10 log [(0.60653) 100.1 Ls[i, (k−1)] + (0.39347) 100.1 L (i, k)]
where Ls(i,k) is the simulated slow time-weighted sound pressure level and L(i,k) is the as-measured 0.5s time average sound pressure level determined from the output of the analyzer for the k-th instant of time and i-th one-third octave band. For k = 1, the slow time-weighted sound pressure Ls[i, (k − 1 = 0)] on the right hand side should be set to 0 dB. An approximation of the continuous exponential averaging is represented by the following equation for a four sample averaging process for k ≥4:
Ls (i,k) = 10 log [(0.13) 100.1 L[i,(k−3)] + (0.21) 100.1 L[i, (k−2)] + (0.27) 100.1 L[i, (k−1)] + (0.39) 100.1 L[i, k]]
where Ls (i, k) is the simulated slow time-weighted sound pressure level and L (i, k) is the as measured 0.5s time average sound pressure level determined from the output of the analyzer for the k-th instant of time and the i-th one-third octave band.
The sum of the weighting factors is 1.0 in the two equations. Sound pressure levels calculated by means of either equation are valid for the sixth and subsequent 0.5s data samples, or for times greater than 2.5s after initiation of data analysis.
Note:
The coefficients in the two equations were calculated for use in determining equivalent slow time-weighted sound pressure levels from samples of 0.5s time average sound pressure levels. The equations do not work with data samples where the averaging time differs from 0.5s.
A36.3.7.6 The instant in time by which a slow time-weighted sound pressure level is characterized must be 0.75s earlier than the actual readout time.
Note:
The definition of this instant in time is needed to correlate the recorded noise with the aircraft position when the noise was emitted and takes into account the averaging period of the slow time-weighting. For each 0.5 second data record this instant in time may also be identified as 1.25 seconds after the start of the associated 2 second averaging period.
A36.3.7.7 The resolution of the sound pressure levels, both displayed and stored, must be 0.1 dB or finer.
A36.3.8 Calibration systems.
A36.3.8.1 The acoustical sensitivity of the measurement system must be determined using a sound calibrator generating a known sound pressure level at a known frequency. The minimum standard for the sound calibrator is the class 1L requirements of IEC 60942 as amended (incorporated by reference, see § 36.6).
A36.3.9 Calibration and checking of system.
A36.3.9.1 Calibration and checking of the measurement system and its constituent components must be carried out to the satisfaction of the FAA by the methods specified in sections A36.3.9.2 through A36.3.9.10. The calibration adjustments, including those for environmental effects on sound calibrator output level, must be reported to the FAA and applied to the measured one-third-octave sound pressure levels determined from the output of the analyzer. Data collected during an overload indication are invalid and may not be used. If the overload condition occurred during recording, the associated test data are invalid, whereas if the overload occurred during analysis, the analysis must be repeated with reduced sensitivity to eliminate the overload.
A36.3.9.2 The free-field frequency response of the microphone system may be determined by use of an electrostatic actuator in combination with manufacturer's data or by tests in an anechoic free-field facility. The correction for frequency response must be determined within 90 days of each test series. The correction for non-uniform frequency response of the microphone system must be reported to the FAA and applied to the measured one-third octave band sound pressure levels determined from the output of the analyzer.
A36.3.9.3 When the angles of incidence of sound emitted from the aircraft are within ±30° of grazing incidence at the microphone (see Figure A36-1), a single set of free-field corrections based on grazing incidence is considered sufficient for correction of directional response effects. For other cases, the angle of incidence for each 0.5 second sample must be determined and applied for the correction of incidence effects.
A36.3.9.4 For analog magnetic tape recorders, each reel of magnetic tape must carry at least 30 seconds of pink random or pseudo-random noise at its beginning and end. Data obtained from analog tape-recorded signals will be accepted as reliable only if level differences in the 10 kHz one-third-octave-band are not more than 0.75 dB for the signals recorded at the beginning and end.
A36.3.9.5 The frequency response of the entire measurement system while deployed in the field during the test series, exclusive of the microphone, must be determined at a level within 5 dB of the level corresponding to the calibration sound pressure level on the level range used during the tests for each one-third octave nominal midband frequency from 50 Hz to 10 kHz inclusive, utilizing pink random or pseudo-random noise. Within six months of each test series the output of the noise generator must be determined by a method traceable to the U.S. National Institute of Standards and Technology or to an equivalent national standards laboratory as determined by the FAA. Changes in the relative output from the previous calibration at each one-third octave band may not exceed 0.2 dB. The correction for frequency response must be reported to the FAA and applied to the measured one-third octave sound pressure levels determined from the output of the analyzer.
A36.3.9.6 The performance of switched attenuators in the equipment used during noise certification measurements and calibration must be checked within six months of each test series to ensure that the maximum error does not exceed 0.1 dB.
A36.3.9.7 The sound pressure level produced in the cavity of the coupler of the sound calibrator must be calculated for the test environmental conditions using the manufacturer's supplied information on the influence of atmospheric air pressure and temperature. This sound pressure level is used to establish the acoustical sensitivity of the measurement system. Within six months of each test series the output of the sound calibrator must be determined by a method traceable to the U.S. National Institute of Standards and Technology or to an equivalent national standards laboratory as determined by the FAA. Changes in output from the previous calibration must not exceed 0.2 dB.
A36.3.9.8 Sufficient sound pressure level calibrations must be made during each test day to ensure that the acoustical sensitivity of the measurement system is known at the prevailing environmental conditions corresponding with each test series. The difference between the acoustical sensitivity levels recorded immediately before and immediately after each test series on each day may not exceed 0.5 dB. The 0.5 dB limit applies after any atmospheric pressure corrections have been determined for the calibrator output level. The arithmetic mean of the before and after measurements must be used to represent the acoustical sensitivity level of the measurement system for that test series. The calibration corrections must be reported to the FAA and applied to the measured one-third octave band sound pressure levels determined from the output of the analyzer.
A36.3.9.9 Each recording medium, such as a reel, cartridge, cassette, or diskette, must carry a sound pressure level calibration of at least 10 seconds duration at its beginning and end.
A36.3.9.10 The free-field insertion loss of the windscreen for each one-third octave nominal midband frequency from 50 Hz to 10 kHz inclusive must be determined with sinusoidal sound signals at the incidence angles determined to be applicable for correction of directional response effects per section A36.3.9.3. The interval between angles tested must not exceed 30 degrees. For a windscreen that is undamaged and uncontaminated, the insertion loss may be taken from manufacturer's data. Alternatively, within six months of each test series the insertion loss of the windscreen may be determined by a method traceable to the U.S. National Institute of Standards and Technology or an equivalent national standards laboratory as determined by the FAA. Changes in the insertion loss from the previous calibration at each one-third-octave frequency band must not exceed 0.4 dB. The correction for the free-field insertion loss of the windscreen must be reported to the FAA and applied to the measured one-third octave sound pressure levels determined from the output of the analyzer.
A36.3.10 Adjustments for ambient noise.
A36.3.10.1 Ambient noise, including both an acoustical background and electrical noise of the measurement system, must be recorded for at least 10 seconds at the measurement points with the system gain set at the levels used for the aircraft noise measurements. Ambient noise must be representative of the acoustical background that exists during the flyover test run. The recorded aircraft noise data is acceptable only if the ambient noise levels, when analyzed in the same way, and quoted in PNL (see A36.4.1.3 (a)), are at least 20 dB below the maximum PNL of the aircraft.
A36.3.10.2 Aircraft sound pressure levels within the 10 dB-down points (see A36.4.5.1) must exceed the mean ambient noise levels determined in section A36.3.10.1 by at least 3 dB in each one-third octave band, or must be adjusted using a method approved by the FAA; one method is described in the current advisory circular for this part.
Section A36.4 Calculation of Effective Perceived Noise Level From Measured Data
A36.4.1 General.
A36.4.1.1 The basic element for noise certification criteria is the noise evaluation measure known as effective perceived noise level, EPNL, in units of EPNdB, which is a single number evaluator of the subjective effects of airplane noise on human beings. EPNL consists of instantaneous perceived noise level, PNL, corrected for spectral irregularities, and for duration. The spectral irregularity correction, called “tone correction factor”, is made at each time increment for only the maximum tone.
A36.4.1.2 Three basic physical properties of sound pressure must be measured: level, frequency distribution, and time variation. To determine EPNL, the instantaneous sound pressure level in each of the 24 one-third octave bands is required for each 0.5 second increment of time during the airplane noise measurement.
A36.4.1.3 The calculation procedure that uses physical measurements of noise to derive the EPNL evaluation measure of subjective response consists of the following five steps:
(a) The 24 one-third octave bands of sound pressure level are converted to perceived noisiness (noy) using the method described in section A36.4.2.1 (a). The noy values are combined and then converted to instantaneous perceived noise levels, PNL(k).
(b) A tone correction factor C(k) is calculated for each spectrum to account for the subjective response to the presence of spectral irregularities.
(c) The tone correction factor is added to the perceived noise level to obtain tone-corrected perceived noise levels PNLT(k), at each one-half second increment:
PNLT(k) = PNL(k) + C(k)
The instantaneous values of tone-corrected perceived noise level are derived and the maximum value, PNLTM, is determined.
(d) A duration correction factor, D, is computed by integration under the curve of tone-corrected perceived noise level versus time.
(e) Effective perceived noise level, EPNL, is determined by the algebraic sum of the maximum tone-corrected perceived noise level and the duration correction factor:
EPNL = PNLTM + D
A36.4.2 Perceived noise level.
A36.4.2.1 Instantaneous perceived noise levels, PNL(k), must be calculated from instantaneous one-third octave band sound pressure levels, SPL(i, k) as follows:
(a) Step 1: For each one-third octave band from 50 through 10,000 Hz, convert SPL(i, k) to perceived noisiness n(i, k), by using the mathematical formulation of the noy table given in section A36.4.7.
(b) Step 2: Combine the perceived noisiness values, n(i, k), determined in step 1 by using the following formula:
$$\begin{aligned} \mathrm{N}(\mathrm{k}) &=\mathrm{n}(\mathrm{k})+0.15\left\{\left[\sum_{\mathrm{i}=1}^{24} \mathrm{n}(\mathrm{i}, \mathrm{k})\right]-\mathrm{n}(\mathrm{k})\right\} \\ &=0.85 \mathrm{n}(\mathrm{k})+0.15 \sum_{\mathrm{i}=1}^{24} \mathrm{n}(\mathrm{i}, \mathrm{k}) \end{aligned}$$
where n(k) is the largest of the 24 values of n(i, k) and N(k) is the total perceived noisiness.
(c) Step 3: Convert the total perceived noisiness, N(k), determined in Step 2 into perceived noise level, PNL(k), using the following formula:
\[ \text{PNL (k)} = 40.0 + \frac{10}{\text{log}\ 2} \text{log}\ N (k) \]
Note:
PNL(k) is plotted in the current advisory circular for this part.
A36.4.3 Correction for spectral irregularities.
A36.4.3.1 Noise having pronounced spectral irregularities (for example, the maximum discrete frequency components or tones) must be adjusted by the correction factor C(k) calculated as follows:
(a) Step 1: After applying the corrections specified under section A36.3.9, start with the sound pressure level in the 80 Hz one-third octave band (band number 3), calculate the changes in sound pressure level (or “slopes”) in the remainder of the one-third octave bands as follows:
s(3,k) = no value
s(4,k) = SPL(4,k)−SPL(3,k)
•
•
s(i,k) = SPL(i,k)−SPL(i−1,k)
•
•
s(24,k) = SPL(24,k)−SPL(23,k)
(b) Step 2: Encircle the value of the slope, s(i, k), where the absolute value of the change in slope is greater than five; that is where:
|Δs(i,k)| = |s(i,k)−s(i−1,k)|>5
(c) Step 3:
(1) If the encircled value of the slope s(i, k) is positive and algebraically greater than the slope s(i−1, k) encircle SPL(i, k).
(2) If the encircled value of the slope s(i, k) is zero or negative and the slope s(i−1, k) is positive, encircle SPL(i−1, k).
(3) For all other cases, no sound pressure level value is to be encircled.
(d) Step 4: Compute new adjusted sound pressure levels SPL′(i, k) as follows:
(1) For non-encircled sound pressure levels, set the new sound pressure levels equal to the original sound pressure levels, SPL′(i, k) = SPL(i, k).
(2) For encircled sound pressure levels in bands 1 through 23 inclusive, set the new sound pressure level equal to the arithmetic average of the preceding and following sound pressure levels as shown below:
SPL′(i,k) = 1⁄2[SPL(i−1,k) + SPL(i + 1,k)]
(3) If the sound pressure level in the highest frequency band (i = 24) is encircled, set the new sound pressure level in that band equal to:
SPL′(24,k) = SPL(23,k) + s(23,k)
(e) Step 5: Recompute new slope s′(i, k), including one for an imaginary 25th band, as follows:
s′(3,k) = s′(4,k)
s′(4,k) = SPL′(4,k)−SPL′(3,k)
•
•
s′(i,k) = SPL′(i,k)−SPL′(i−1,k)
•
•
s′(24,k) = SPL′(24,k)−SPL′(23,k)
s′(25,k) = s′(24,k)
(f) Step 6: For i, from 3 through 23, compute the arithmetic average of the three adjacent slopes as follows:
s
(g) Step 7: Compute final one-third octave-band sound pressure levels, SPL′ (i,k), by beginning with band number 3 and proceeding to band number 24 as follows:
SPL′(3,k) = SPL(3,k)
SPL′(4,k) = SPL′(3,k) + s
•
•
SPL′(i,k) = SPL′(i−1,k) + s
•
•
SPL′(24,k) = SPL′(23,k) + s
(h) Setp 8: Calculate the differences, F (i,k), between the original sound pressure level and the final background sound pressure level as follows:
F(i,k) = SPL(i,k)-SPL′(i,k)
and note only values equal to or greater than 1.5.
(i) Step 9: For each of the relevant one-third octave bands (3 through 24), determine tone correction factors from the sound pressure level differences F (i, k) and Table A36-2.
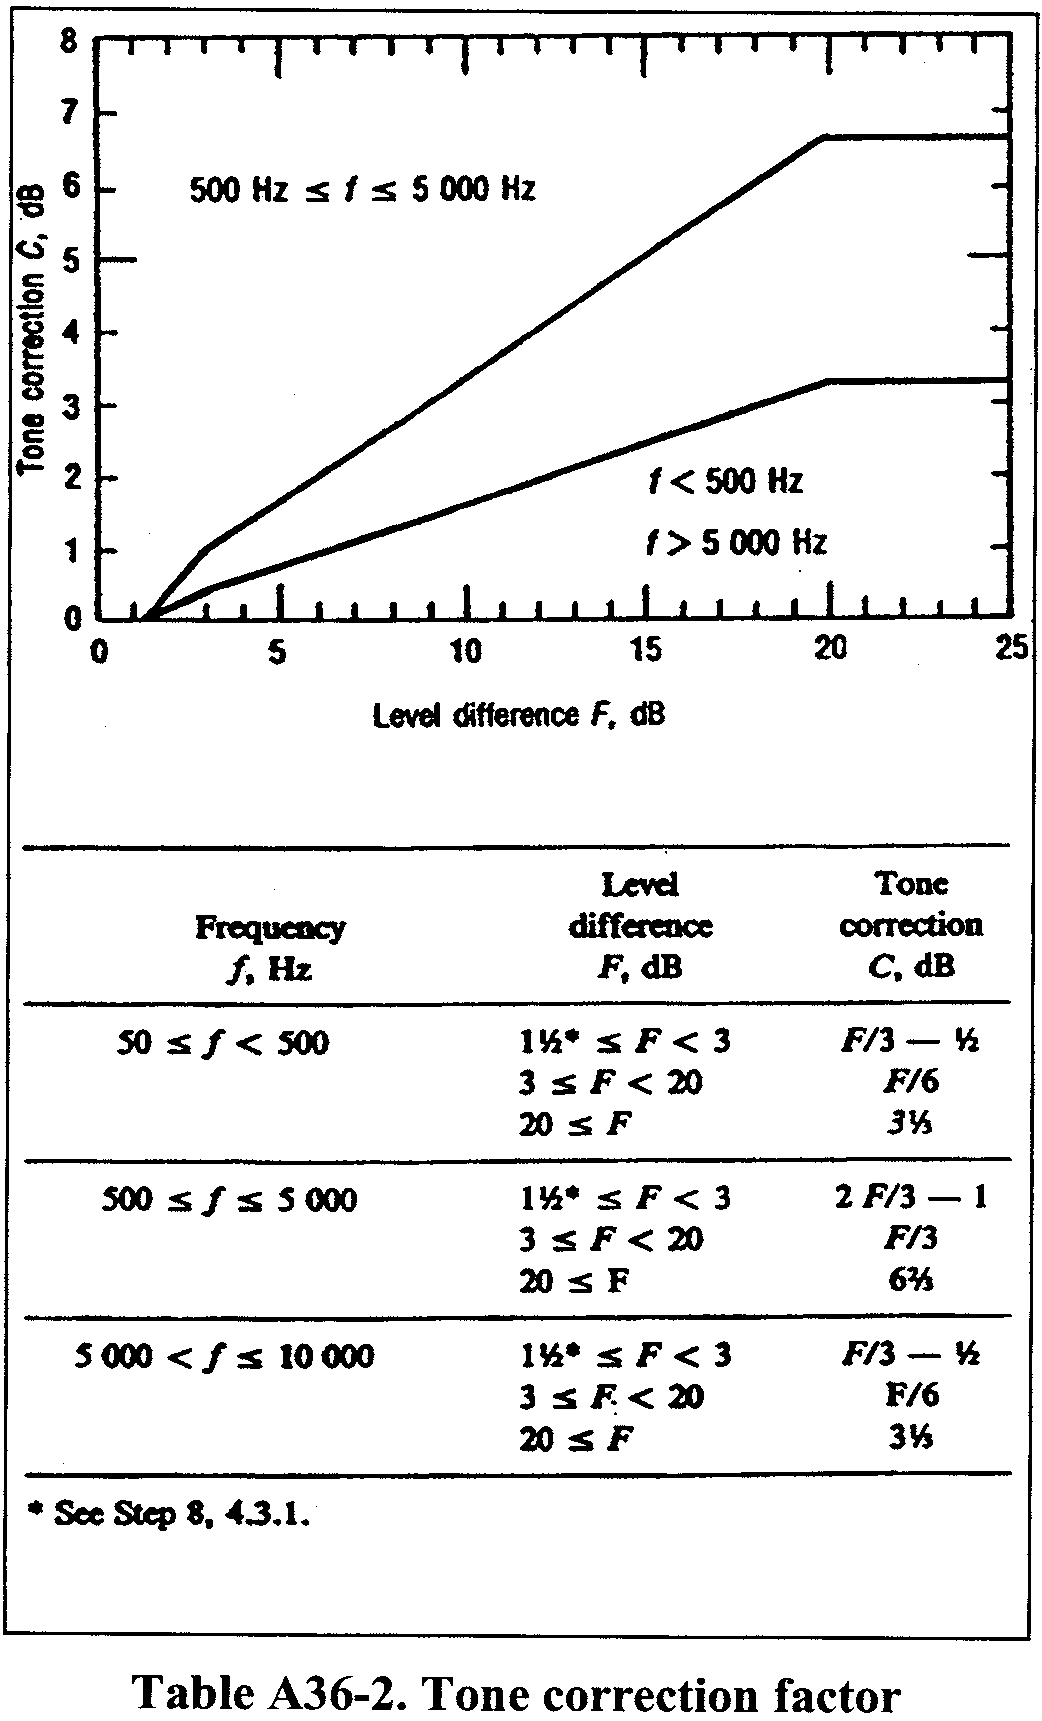
(j) Step 10: Designate the largest of the tone correction factors, determined in Step 9, as C(k). (An example of the tone correction procedure is given in the current advisory circular for this part). Tone-corrected perceived noise levels PNLT(k) must be determined by adding the C(k) values to corresponding PNL(k) values, that is:
PNLT(k) = PNL(k) + C(k)
For any i-th one-third octave band, at any k-th increment of time, for which the tone correction factor is suspected to result from something other than (or in addition to) an actual tone (or any spectral irregularity other than airplane noise), an additional analysis may be made using a filter with a bandwidth narrower than one-third of an octave. If the narrow band analysis corroborates these suspicions, then a revised value for the background sound pressure level SPL′(i,k), may be determined from the narrow band analysis and used to compute a revised tone correction factor for that particular one-third octave band. Other methods of rejecting spurious tone corrections may be approved.
A36.4.3.2 The tone correction procedure will underestimate EPNL if an important tone is of a frequency such that it is recorded in two adjacent one-third octave bands. An applicant must demonstrate that either:
(a) No important tones are recorded in two adjacent one-third octave bands; or
(b) That if an important tone has occurred, the tone correction has been adjusted to the value it would have had if the tone had been recorded fully in a single one-third octave band.
A36.4.4 Maximum tone-corrected perceived noise level
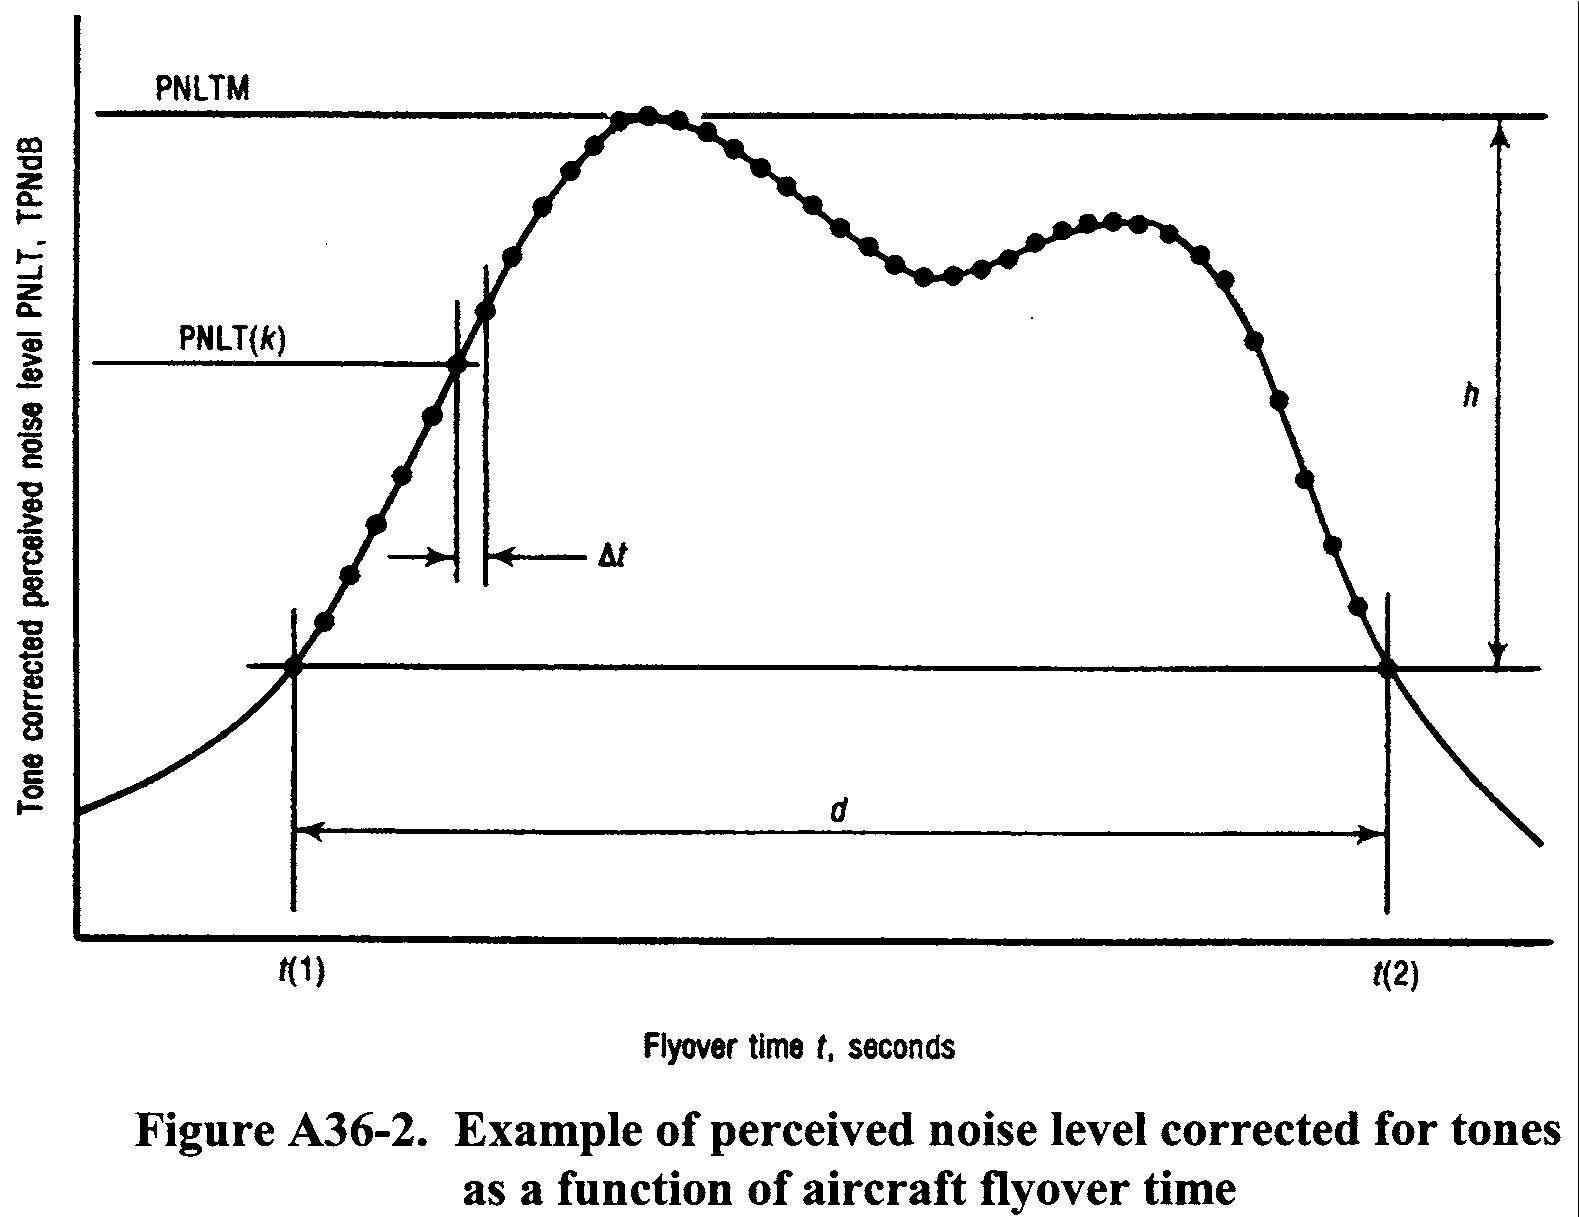
A36.4.4.1 The maximum tone-corrected perceived noise level, PNLTM, must be the maximum calculated value of the tone-corrected perceived noise level PNLT(k). It must be calculated using the procedure of section A36.4.3. To obtain a satisfactory noise time history, measurements must be made at 0.5 second time intervals.
Note 1:
Figure A36-2 is an example of a flyover noise time history where the maximum value is clearly indicated.
Note 2:
In the absence of a tone correction factor, PNLTM would equal PNLM.
A36.4.4.2 After the value of PNLTM is obtained, the frequency band for the largest tone correction factor is identified for the two preceding and two succeeding 500 ms data samples. This is performed in order to identity the possibility of tone suppression at PNLTM by one-third octave band sharing of that tone. If the value of the tone correction factor C(k) for PNLTM is less than the average value of C(k) for the five consecutive time intervals, the average value of C(k) must be used to compute a new value for PNLTM.
A36.4.5 Duration correction.
A36.4.5.1 The duration correction factor D determined by the integration technique is defined by the expression:
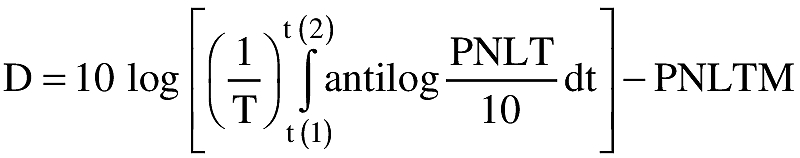
where T is a normalizing time constant, PNLTM is the maximum value of PNLT, t(1) is the first point of time after which PNLT becomes greater than PNLTM-10, and t(2) is the point of time after which PNLT remains constantly less than PNLTM-10.
A36.4.5.2 Since PNLT is calculated from measured values of sound pressure level (SPL), there is no obvious equation for PNLT as a function of time. Consequently, the equation is to be rewritten with a summation sign instead of an integral sign as follows:
where Δt is the length of the equal increments of time for which PNLT(k) is calculated and d is the time interval to the nearest 0.5s during which PNLT(k) remains greater or equal to PNLTM-10.
A36.4.5.3 To obtain a satisfactory history of the perceived noise level use one of the following:
(a) Half-Second time intervals for Δt; or
(b) A shorter time interval with approved limits and constants.
A36.4.5.4 The following values for T and Δt must be used in calculating D in the equation given in section A36.4.5.2:
T = 10 s, and
Δt = 0.5s (or the approved sampling time interval).
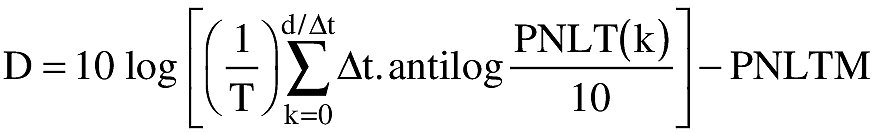
Using these values, the equation for D becomes:
\[ \text{D} = 10\ \text{log} \left[ \sum^{2d}_{k=0} \text{antilog} \frac{\text{PNLT(k)}}{10} \right] - \text{PNLTM} - 13 \]
where d is the duration time defined by the points corresponding to the values PNLTM-10.
A36.4.5.5 If in using the procedures given in section A36.4.5.2, the limits of PNLTM-10 fall between the calculated PNLT(k) values (the usual case), the PNLT(k) values defining the limits of the duration interval must be chosen from the PNLT(k) values closest to PNLTM-10. For those cases with more than one peak value of PNLT(k), the applicable limits must be chosen to yield the largest possible value for the duration time.
A36.4.6 Effective perceived noise level.
The total subjective effect of an airplane noise event, designated effective perceived noise level, EPNL, is equal to the algebraic sum of the maximum value of the tone-corrected perceived noise level, PNLTM, and the duration correction D. That is:
EPNL = PNLTM + D
where PNLTM and D are calculated using the procedures given in sections A36.4.2, A36.4.3, A36.4.4. and A36.4.5.
A36.4.7 Mathematical formulation of noy tables.
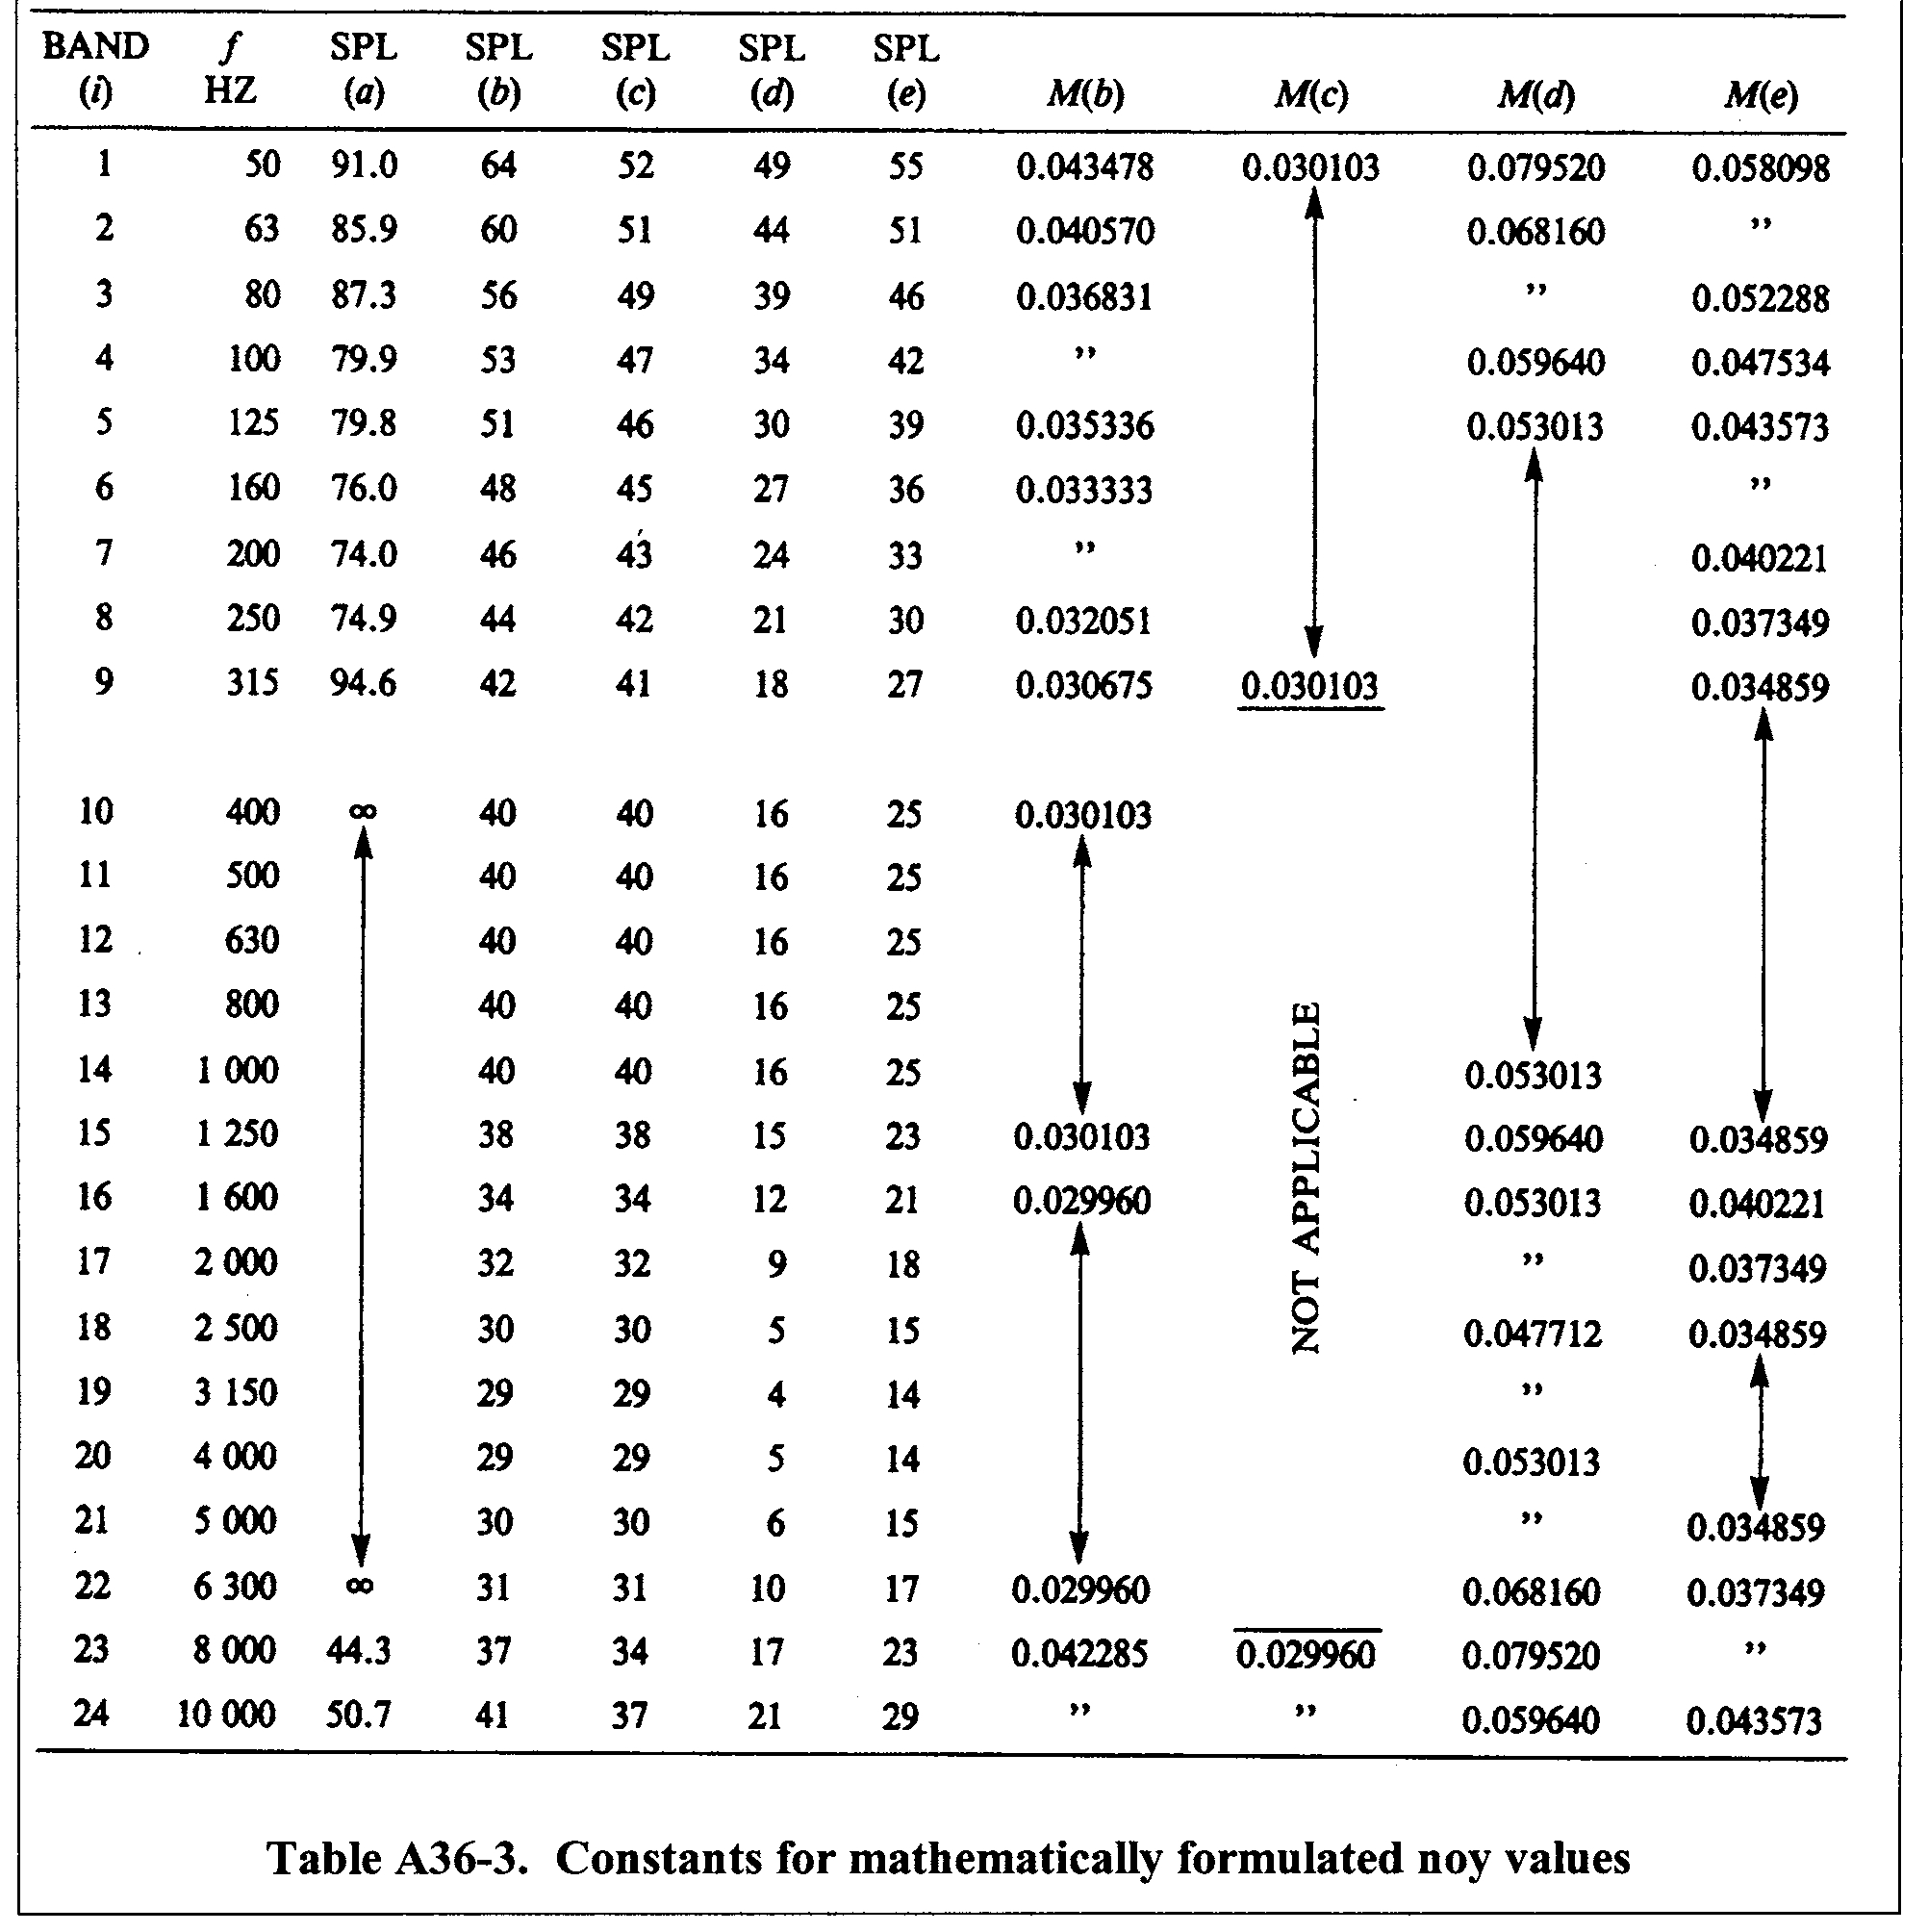
A36.4.7.1 The relationship between sound pressure level (SPL) and the logarithm of perceived noisiness is illustrated in Figure A36-3 and Table A36-3.
A36.4.7.2 The bases of the mathematical formulation are:
(a) The slopes (M(b), M(c), M(d) and M(e)) of the straight lines;
(b) The intercepts (SPL(b) and SPL(c)) of the lines on the SPL axis; and
(c) The coordinates of the discontinuities, SPL(a) and log n(a); SPL(d) and log n = −1.0; and SPL(e) and log n = log (0.3).
A36.4.7.3 Calculate noy values using the following equations:
(a)
SPL ≥SPL (a)
n = antilog {(c)[SPL−SPL(c)]}
(b)
SPL(b) ≤SPL
n = antilog {M(b)[SPL−SPL(b)]}
(c)
SPL(e) ≤SPL
n = 0.3 antilog {M(e)[SPL−SPL(e)]}
(d)
SPL(d) ≤SPL 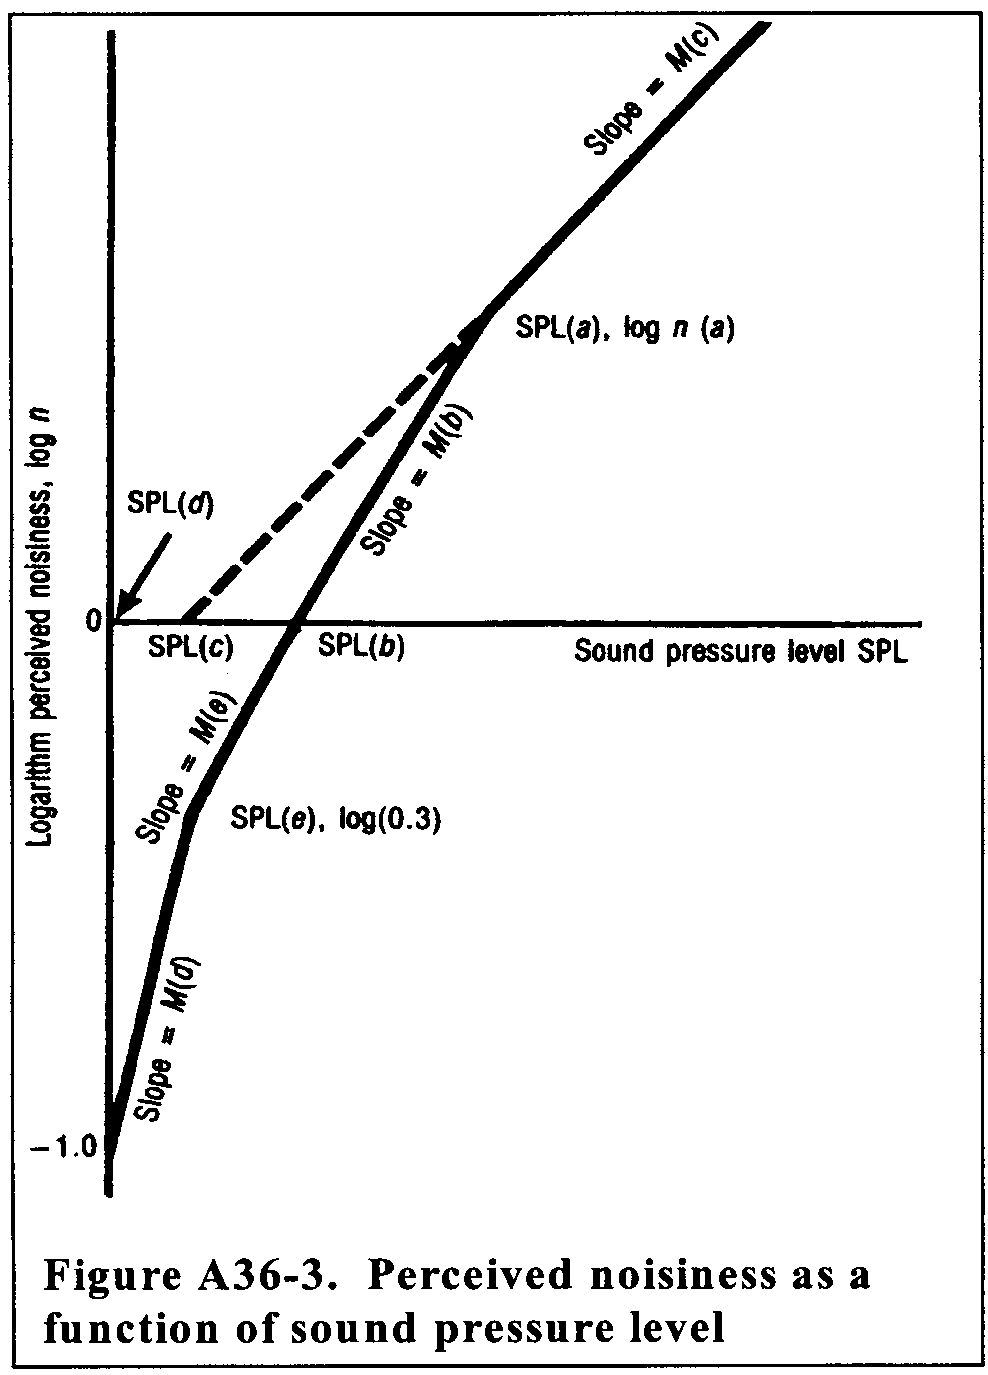
![Equation for Section A36.8 [Reserved]](https://aviation-regulations.com/img/graphics/er08jy02.014.jpg)
n = 0.1 antilog {M(d)[SPL−SPL(d)]}
A36.4.7.4 Table A36-3 lists the values of the constants necessary to calculate perceived noisiness as a function of sound pressure level.
Section A36.5 Reporting of Data to the FAA
A36.5.1 General.
A36.5.1.1 Data representing physical measurements and data used to make corrections to physical measurements must be recorded in an approved permanent form and appended to the record.
A36.5.1.2 All corrections must be reported to and approved by the FAA, including corrections to measurements for equipment response deviations.
A36.5.1.3 Applicants may be required to submit estimates of the individual errors inherent in each of the operations employed in obtaining the final data.
A36.5.2 Data reporting.
An applicant is required to submit a noise certification compliance report that includes the following.
A36.5.2.1 The applicant must present measured and corrected sound pressure levels in one-third octave band levels that are obtained with equipment conforming to the standards described in section A36.3 of this appendix.
A36.5.2.2 The applicant must report the make and model of equipment used for measurement and analysis of all acoustic performance and meteorological data.
A36.5.2.3 The applicant must report the following atmospheric environmental data, as measured immediately before, after, or during each test at the observation points prescribed in section A36.2 of this appendix.
(a) Air temperature and relative humidity;
(b) Maximum, minimum and average wind velocities; and
(c) Atmospheric pressure.
A36.5.2.4 The applicant must report conditions of local topography, ground cover, and events that might interfere with sound recordings.
A36.5.2.5 The applicant must report the following:
(a) Type, model and serial numbers (if any) of airplane, engine(s), or propeller(s) (as applicable);
(b) Gross dimensions of airplane and location of engines;
(c) Airplane gross weight for each test run and center of gravity range for each series of test runs;
(d) Airplane configuration such as flap, airbrakes and landing gear positions for each test run;
(e) Whether auxiliary power units (APU), when fitted, are operating for each test run;
(f) Status of pneumatic engine bleeds and engine power take-offs for each test run;
(g) Indicated airspeed in knots or kilometers per hour for each test run;
(h) Engine performance data:
(1) For jet airplanes: engine performance in terms of net thrust, engine pressure ratios, jet exhaust temperatures and fan or compressor shaft rotational speeds as determined from airplane instruments and manufacturer's data for each test run;
(2) For propeller-driven airplanes: engine performance in terms of brake horsepower and residual thrust; or equivalent shaft horsepower; or engine torque and propeller rotational speed; as determined from airplane instruments and manufacturer's data for each test run;
(i) Airplane flight path and ground speed during each test run; and
(j) The applicant must report whether the airplane has any modifications or non-standard equipment likely to affect the noise characteristics of the airplane. The FAA must approve any such modifications or non-standard equipment.
A36.5.3 Reporting of noise certification reference conditions.
A36.5.3.1 Airplane position and performance data and the noise measurements must be corrected to the noise certification reference conditions specified in the relevant sections of appendix B of this part. The applicant must report these conditions, including reference parameters, procedures and configurations.
A36.5.4 Validity of results.
A36.5.4.1 Three average reference EPNL values and their 90 percent confidence limits must be produced from the test results and reported, each such value being the arithmetical average of the adjusted acoustical measurements for all valid test runs at each measurement point (flyover, lateral, or approach). If more than one acoustic measurement system is used at any single measurement location, the resulting data for each test run must be averaged as a single measurement. The calculation must be performed by:
(a) Computing the arithmetic average for each flight phase using the values from each microphone point; and
(b) Computing the overall arithmetic average for each reference condition (flyover, lateral or approach) using the values in paragraph (a) of this section and the related 90 percent confidence limits.
A36.5.4.2 For each of the three certification measuring points, the minimum sample size is six. The sample size must be large enough to establish statistically for each of the three average noise certification levels a 90 percent confidence limit not exceeding ±1.5 EPNdB. No test result may be omitted from the averaging process unless approved by the FAA.
Note:
Permitted methods for calculating the 90 percent confidence interval are shown in the current advisory circular for this part.
A36.5.4.3 The average EPNL figures obtained by the process described in section A36.5.4.1 must be those by which the noise performance of the airplane is assessed against the noise certification criteria.
Section A36.6 Nomenclature: Symbols and Units
Symbol | Unit | Meaning |
|---|---|---|
antilog | Antilogarithm to the base 10. | |
C(k) | dB | Tone correction factor. The factor to be added to PNL(k) to account for the presence of spectral irregularities such as tones at the k-th increment of time. |
d | s | Duration time. The time interval between the limits of t(1) and t(2) to the nearest 0.5 second. |
D | dB | Duration correction. The factor to be added to PNLTM to account for the duration of the noise. |
EPNL | EPNdB | Effective perceived noise level. The value of PNL adjusted for both spectral irregularities and duration of the noise. (The unit EPNdB is used instead of the unit dB). |
EPNLr | EPNdB | Effective perceived noise level adjusted for reference conditions. |
f(i) | Hz | Frequency. The geometrical mean frequency for the i-th one-third octave band. |
F (i, k) | dB | Delta-dB. The difference between the original sound pressure level and the final background sound pressure level in the i-th one-third octave band at the k-th interval of time. In this case, background sound pressure level means the broadband noise level that would be present in the one-third octave band in the absence of the tone. |
h | dB | dB-down. The value to be subtracted from PNLTM that defines the duration of the noise. |
H | Percent | Relative humidity. The ambient atmospheric relative humidity. |
i | Frequency band index. The numerical indicator that denotes any one of the 24 one-third octave bands with geometrical mean frequencies from 50 to 10,000 Hz. | |
k | Time increment index. The numerical indicator that denotes the number of equal time increments that have elapsed from a reference zero. | |
Log | Logarithm to the base 10. | |
log n(a) | Noy discontinuity coordinate. The log n value of the intersection point of the straight lines representing the variation of SPL with log n. | |
M(b), M(c), etc | Noy inverse slope. The reciprocals of the slopes of straight lines representing the variation of SPL with log n. | |
n | noy | The perceived noisiness at any instant of time that occurs in a specified frequency range. |
n(i,k) | noy | The perceived noisiness at the k-th instant of time that occurs in the i-th one-third octave band. |
n(k) | noy | Maximum perceived noisiness. The maximum value of all of the 24 values of n(i) that occurs at the k-th instant of time. |
N(k) | noy | Total perceived noisiness. The total perceived noisiness at the k-th instant of time calculated from the 24-instantaneous values of n (i, k). |
p(b), p(c), etc | Noy slope. The slopes of straight lines representing the variation of SPL with log n. | |
PNL | PNdB | The perceived noise level at any instant of time. (The unit PNdB is used instead of the unit dB). |
PNL(k) | PNdB | The perceived noise level calculated from the 24 values of SPL (i, k), at the k-th increment of time. (The unit PNdB is used instead of the unit dB). |
PNLM | PNdB | Maximum perceived noise level. The maximum value of PNL(k). (The unit PNdB is used instead of the unit dB). |
PNLT | TPNdB | Tone-corrected perceived noise level. The value of PNL adjusted for the spectral irregularities that occur at any instant of time. (The unit TPNdB is used instead of the unit dB). |
PNLT(k) | TPNdB | The tone-corrected perceived noise level that occurs at the k-th increment of time. PNLT(k) is obtained by adjusting the value of PNL(k) for the spectral irregularities that occur at the k-th increment of time. (The unit TPNdB is used instead of the unit dB). |
PNLTM | TPNdB | Maximum tone-corrected perceived noise level. The maximum value of PNLT(k). (The unit TPNdB is used instead of the unit dB). |
PNLTr | TPNdB | Tone-corrected perceived noise level adjusted for reference conditions. |
s (i, k) | dB | Slope of sound pressure level. The change in level between adjacent one-third octave band sound pressure levels at the i-th band for the k-th instant of time. |
Δs (i, k) | dB | Change in slope of sound pressure level. |
s′ (i, k) | dB | Adjusted slope of sound pressure level. The change in level between adjacent adjusted one-third octave band sound pressure levels at the i-th band for the k-th instant of time. |
s | dB | Average slope of sound pressure level. |
SPL | dB re20 µPa | Sound pressure level. The sound pressure level that occurs in a specified frequency range at any instant of time. |
SPL(a) | dB re20 µPa | Noy discontinuity coordinate. The SPL value of the intersection point of the straight lines representing the variation of SPL with log n. |
SPL(b)SPL (c) | dB re20 µPa | Noy intercept. The intercepts on the SPL-axis of the straight lines representing the variation of SPL with log n. |
SPL (i, k) | dB re20 µPa | The sound pressure level at the k-th instant of time that occurs in the i-th one-third octave band. |
SPL′ (i, k) | dB re20 µPa | Adjusted sound pressure level. The first approximation to background sound pressure level in the i-th one-third octave band for the k-th instant of time. |
SPL(i) | dB re20 µPa | Maximum sound pressure level. The sound pressure level that occurs in the i-th one-third octave band of the spectrum for PNLTM. |
SPL(i)r | dB re20 µPa | Corrected maximum sound pressure level. The sound pressure level that occurs in the i-th one-third octave band of the spectrum for PNLTM corrected for atmospheric sound absorption. |
SPL′ (i, k) | dB re20 µPa | Final background sound pressure level. The second and final approximation to background sound pressure level in the i-th one-third octave band for the k-th instant of time. |
t | s | Elapsed time. The length of time measured from a reference zero. |
t(1), t(2) | s | Time limit. The beginning and end, respectively, of the noise time history defined by h. |
Δt | s | Time increment. The equal increments of time for which PNL(k) and PNLT(k) are calculated. |
T | s | Normalizing time constant. The length of time used as a reference in the integration method for computing duration corrections, where T = 10s. |
t(°F) (°C) | °F, °C | Temperature. The ambient air temperature. |
α(i) | dB/1000ft db/100m | Test atmospheric absorption. The atmospheric attenuation of sound that occurs in the i-th one-third octave band at the measured air temperature and relative humidity. |
α(i)o | dB/1000ft db/100m | Reference atmospheric absorption. The atmospheric attenuation of sound that occurs in the i-th one-third octave band at a reference air temperature and relative humidity. |
A1 | Degrees | First constant climb angle (Gear up, speed of at least V2 + 10 kt (V2 + 19 km/h), takeoff thrust). |
A2 | Degrees | Second constant climb angle (Gear up, speed of at least V2 + 10 kt (V2 + 19 km/h), after cut-back). |
δε | Degrees | Thrust cutback angles. The angles defining the points on the takeoff flight path at which thrust reduction is started and ended respectively. |
η | Degrees | Approach angle. |
ηr | Degrees | Reference approach angle. |
θ | Degrees | Noise angle (relative to flight path). The angle between the flight path and noise path. It is identical for both measured and corrected flight paths. |
ψ | Degrees | Noise angle (relative to ground). The angle between the noise path and the ground. It is identical for both measured and corrected flight paths. |
μ | Engine noise emission parameter. | |
μr | Reference engine noise emission parameter. | |
Δ1 | EPNdB | PNLT correction. The correction to be added to the EPNL calculated from measured data to account for noise level changes due to differences in atmospheric absorption and noise path length between reference and test conditions. |
Δ2 | EPNdB | Adjustment to duration correction. The adjustment to be made to the EPNL calculated from measured data to account for noise level changes due to the noise duration between reference and test conditions. |
Δ3 | EPNdB | Source noise adjustment. The adjustment to be made to the EPNL calculated from measured data to account for noise level changes due to differences between reference and test engine operating conditions. |
Section A36.7 Sound Attenuation in Air
A36.7.1 The atmospheric attenuation of sound must be determined in accordance with the procedure presented in section A36.7.2.
A36.7.2 The relationship between sound attenuation, frequency, temperature, and humidity is expressed by the following equations.
A36.7.2(a) For calculations using the English System of Units:
$$\begin{aligned} \alpha(\mathrm{i}) &=10^{\left[2.05 \log \left(f_{0} / 1000\right)+6.33 \times 10^{-4} \theta-1.45325\right]} \\ &+\eta(\delta) \times 10^{\left[\log \left(f_{0}\right)+4.6833 \times 10^{-3} \theta-2.4215\right]} \end{aligned}$$
and
$$\begin{aligned} \delta &=\sqrt{\frac{1010}{f(0)}} 10^{\left(\log \mathrm{H}-1.97274664+2.288074 \times 10^{-2} \theta\right)} \\ & \times 10^{\left(-9.589 \times 10^{-5} \mathrm{\theta}^{2}+3.0 \times 10^{-7} \theta^{3}\right)} \end{aligned}$$
where
η(δ) is listed in Table A36-4 and f0 in Table A36-5;
α(i) is the attenuation coefficient in dB/1000 ft;
θ is the temperature in °F; and
H is the relative humidity, expressed as a percentage.
A36.7.2(b) For calculations using the International System of Units (SI):
$$\begin{aligned} \alpha(\mathrm{i}) &=10^{\left[2.05 \log \left(f_{0} / 1000\right)+1.1394\times 10^{-3} \theta-1.916984\right]} \\ &+\eta(\delta) \times 10^{\left[\log \left(f_{0}\right)+8.42994 \times 10^{-3} \theta-2.755624\right]} \end{aligned}$$
and
$$\begin{aligned} \delta &=\sqrt{\frac{1010}{f_{0}}} 10^{\left(\log \mathrm{H}-1.328924+3.179768 \times 10^{-2} \theta\right)} \\ & \times 10^{\left(-2.173716 \times 10^{-4} \mathrm{\theta}^{2}+1.7496 \times 10^{-6} \theta^{3}\right)} \end{aligned}$$
where
η(δ) is listed in Table A36-4 and f0 in Table A36-5;
α(i) is the attenuation coefficient in dB/100 m;
θ is the temperature in °C; and
H is the relative humidity, expressed as a percentage.
A36.7.3 The values listed in table A36-4 are to be used when calculating the equations listed in section A36.7.2. A term of quadratic interpolation is to be used where necessary.
Section A36.8 [Reserved]
Section A36.9 Adjustment of Airplane Flight Test Results.
A36.9.1 When certification test conditions are not identical to reference conditions, appropriate adjustments must be made to the measured noise data using the methods described in this section.
A36.9.1.1 Adjustments to the measured noise values must be made using one of the methods described in sections A36.9.3 and A36.9.4 for differences in the following:
(a) Attenuation of the noise along its path as affected by “inverse square” and atmospheric attenuation
(b) Duration of the noise as affected by the distance and the speed of the airplane relative to the measuring point
(c) Source noise emitted by the engine as affected by the differences between test and reference engine operating conditions
(d) Airplane/engine source noise as affected by differences between test and reference airspeeds. In addition to the effect on duration, the effects of airspeed on component noise sources must be accounted for as follows: for conventional airplane configurations, when differences between test and reference airspeeds exceed 15 knots (28 km/h) true airspeed, test data and/or analysis approved by the FAA must be used to quantify the effects of the airspeed adjustment on resulting certification noise levels.
A36.9.1.2 The “integrated” method of adjustment, described in section A36.9.4, must be used on takeoff or approach under the following conditions:
(a) When the amount of the adjustment (using the “simplified” method) is greater than 8 dB on flyover, or 4 dB on approach; or
(b) When the resulting final EPNL value on flyover or approach (using the simplified method) is within 1 dB of the limiting noise levels as prescribed in section B36.5 of this part.
A36.9.2 Flight profiles.
As described below, flight profiles for both test and reference conditions are defined by their geometry relative to the ground, together with the associated airplane speed relative to the ground, and the associated engine control parameter(s) used for determining the noise emission of the airplane.
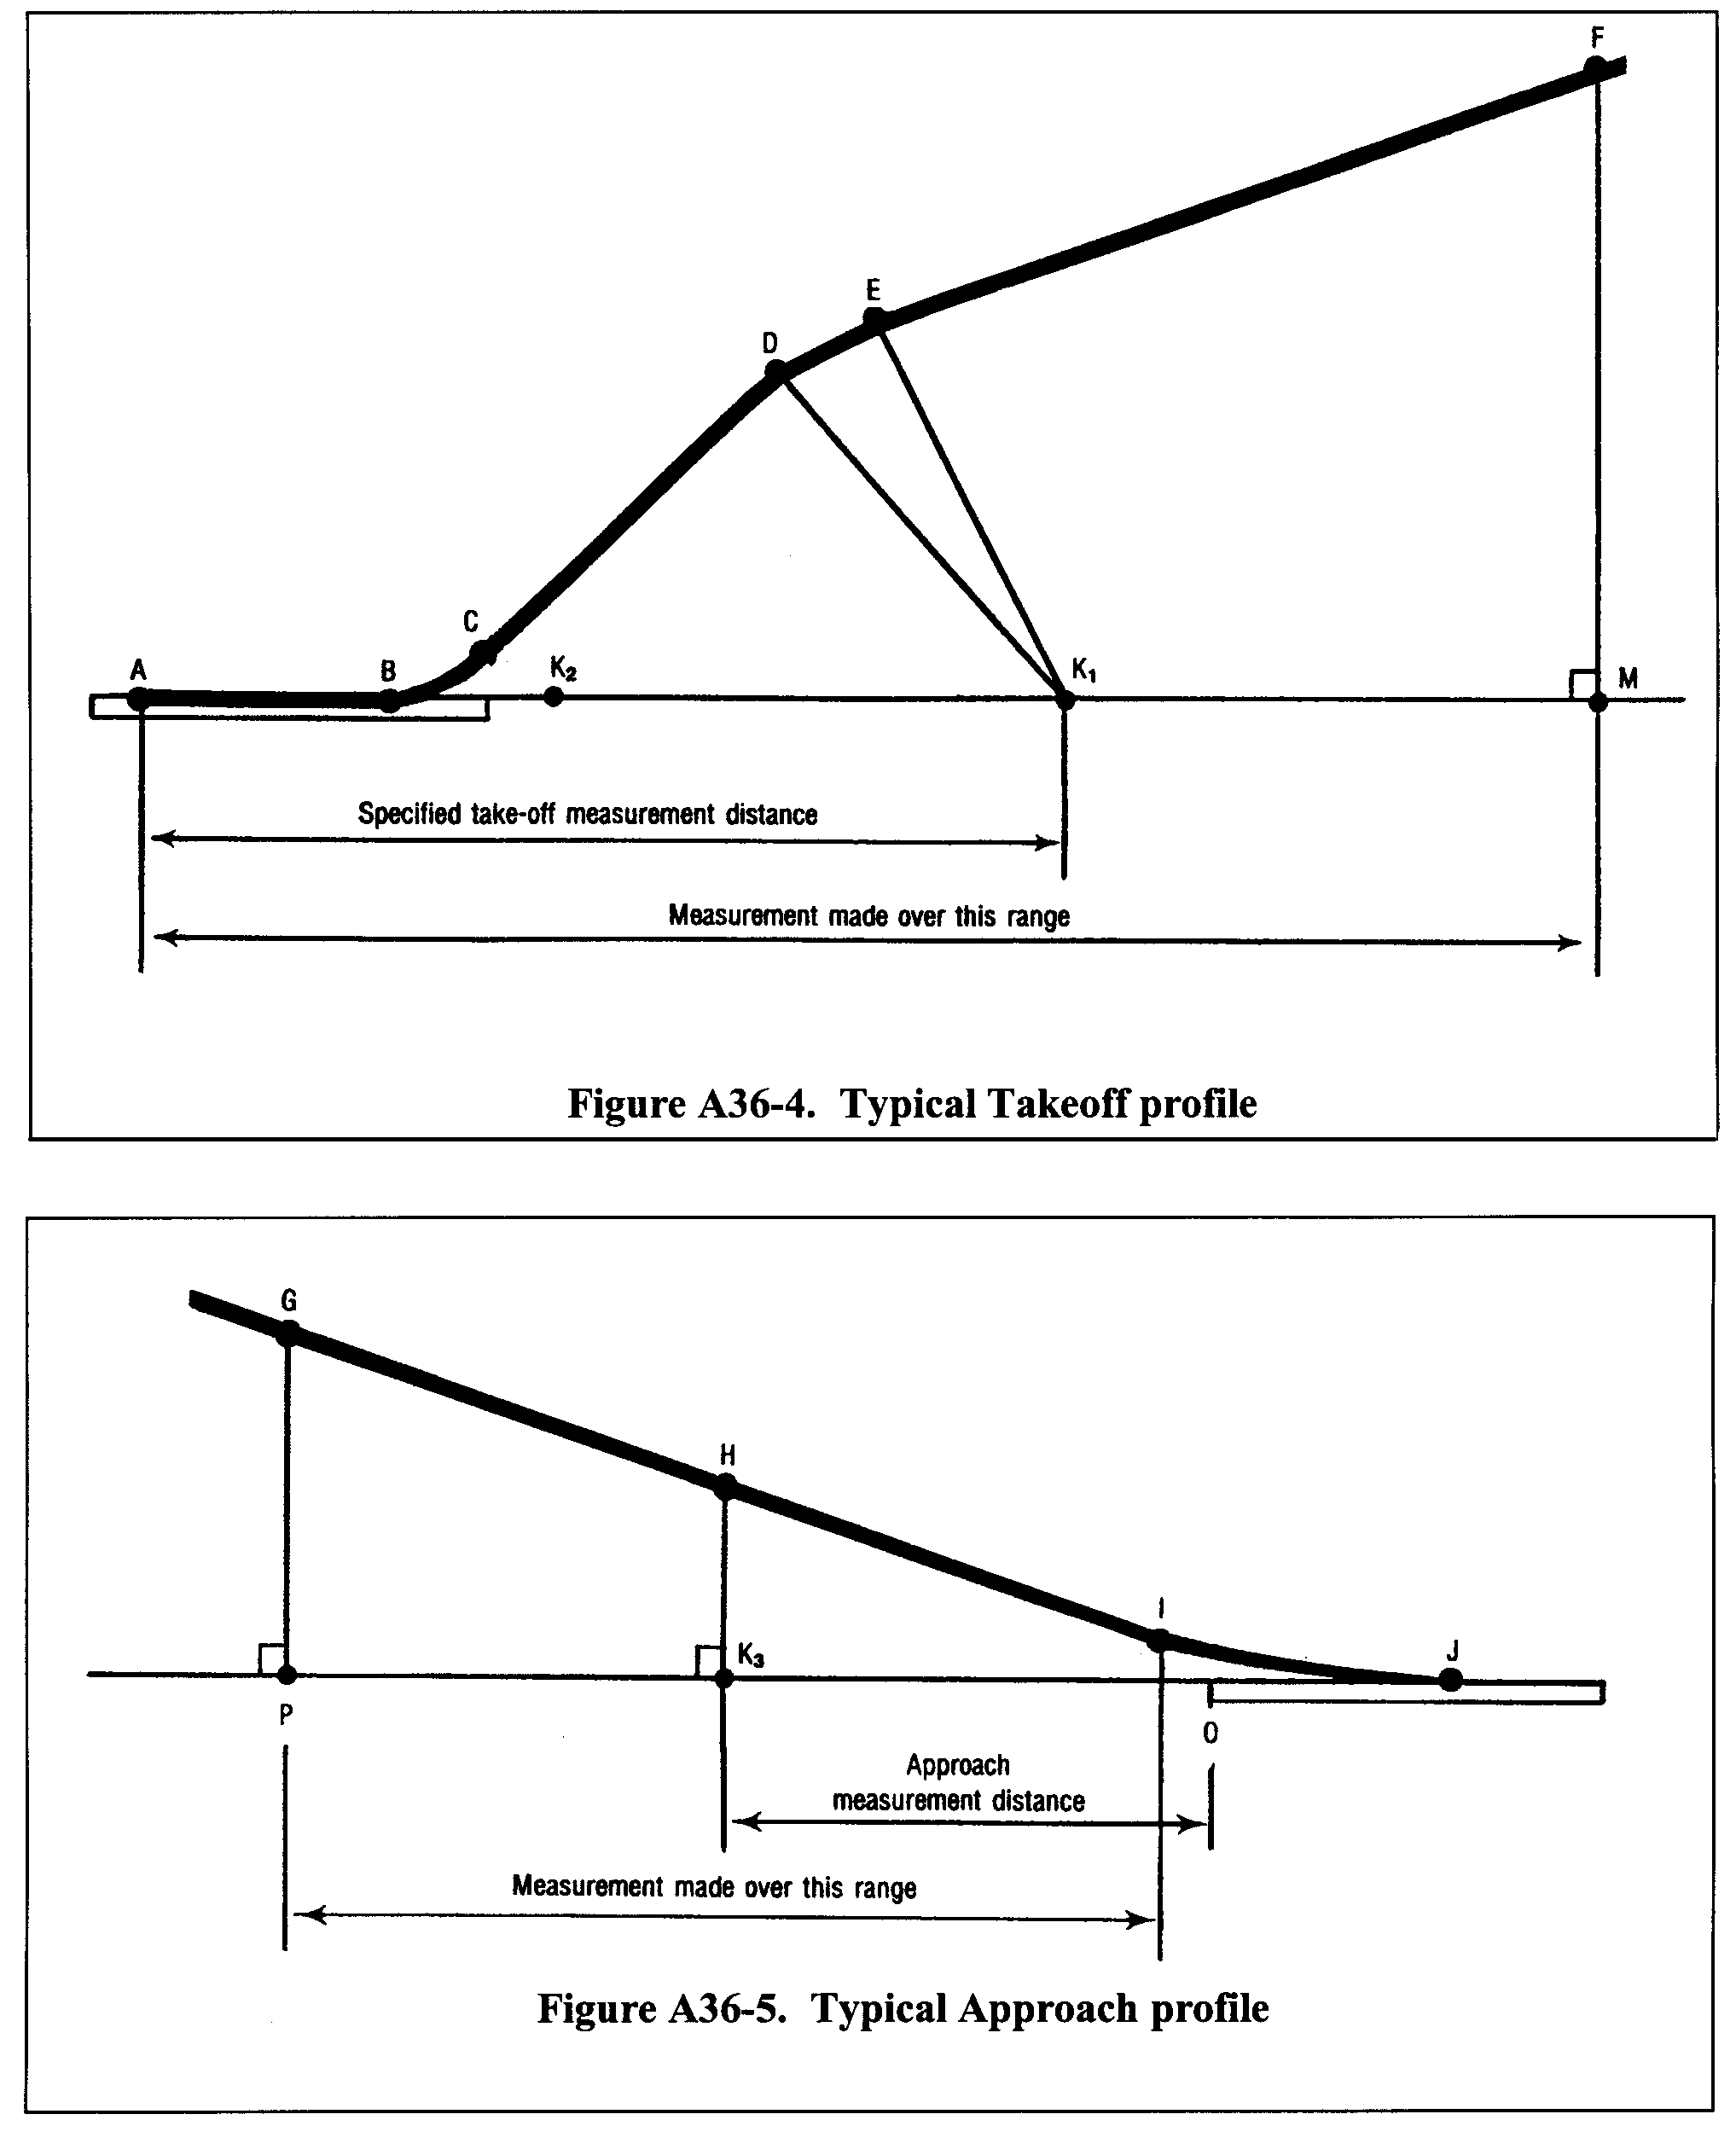
A36.9.2.1 Takeoff Profile.
Note:
Figure A36-4 illustrates a typical takeoff profile.
(a) The airplane begins the takeoff roll at point A, lifts off at point B and begins its first climb at a constant angle at point C. Where thrust or power (as appropriate) cut-back is used, it is started at point D and completed at point E. From here, the airplane begins a second climb at a constant angle up to point F, the end of the noise certification takeoff flight path.
(b) Position K1 is the takeoff noise measuring station and AK1 is the distance from start of roll to the flyover measuring point. Position K2 is the lateral noise measuring station, which is located on a line parallel to, and the specified distance from, the runway center line where the noise level during takeoff is greatest.
(c) The distance AF is the distance over which the airplane position is measured and synchronized with the noise measurements, as required by section A36.2.3.2 of this part.
A36.9.2.2 Approach Profile.
Note:
Figure A36-5 illustrates a typical approach profile.
(a) The airplane begins its noise certification approach flight path at point G and touches down on the runway at point J, at a distance OJ from the runway threshold.
(b) Position K3 is the approach noise measuring station and K3O is the distance from the approach noise measurement point to the runway threshold.
(c) The distance GI is the distance over which the airplane position is measured and synchronized with the noise measurements, as required by section A36.2.3.2 of this part.
The airplane reference point for approach measurements is the instrument landing system (ILS) antenna. If no ILS antenna is installed an alternative reference point must be approved by the FAA.
A36.9.3 Simplified method of adjustment.
A36.9.3.1 General. As described below, the simplified adjustment method consists of applying adjustments (to the EPNL, which is calculated from the measured data) for the differences between measured and reference conditions at the moment of PNLTM.
A36.9.3.2 Adjustments to PNL and PNLT.
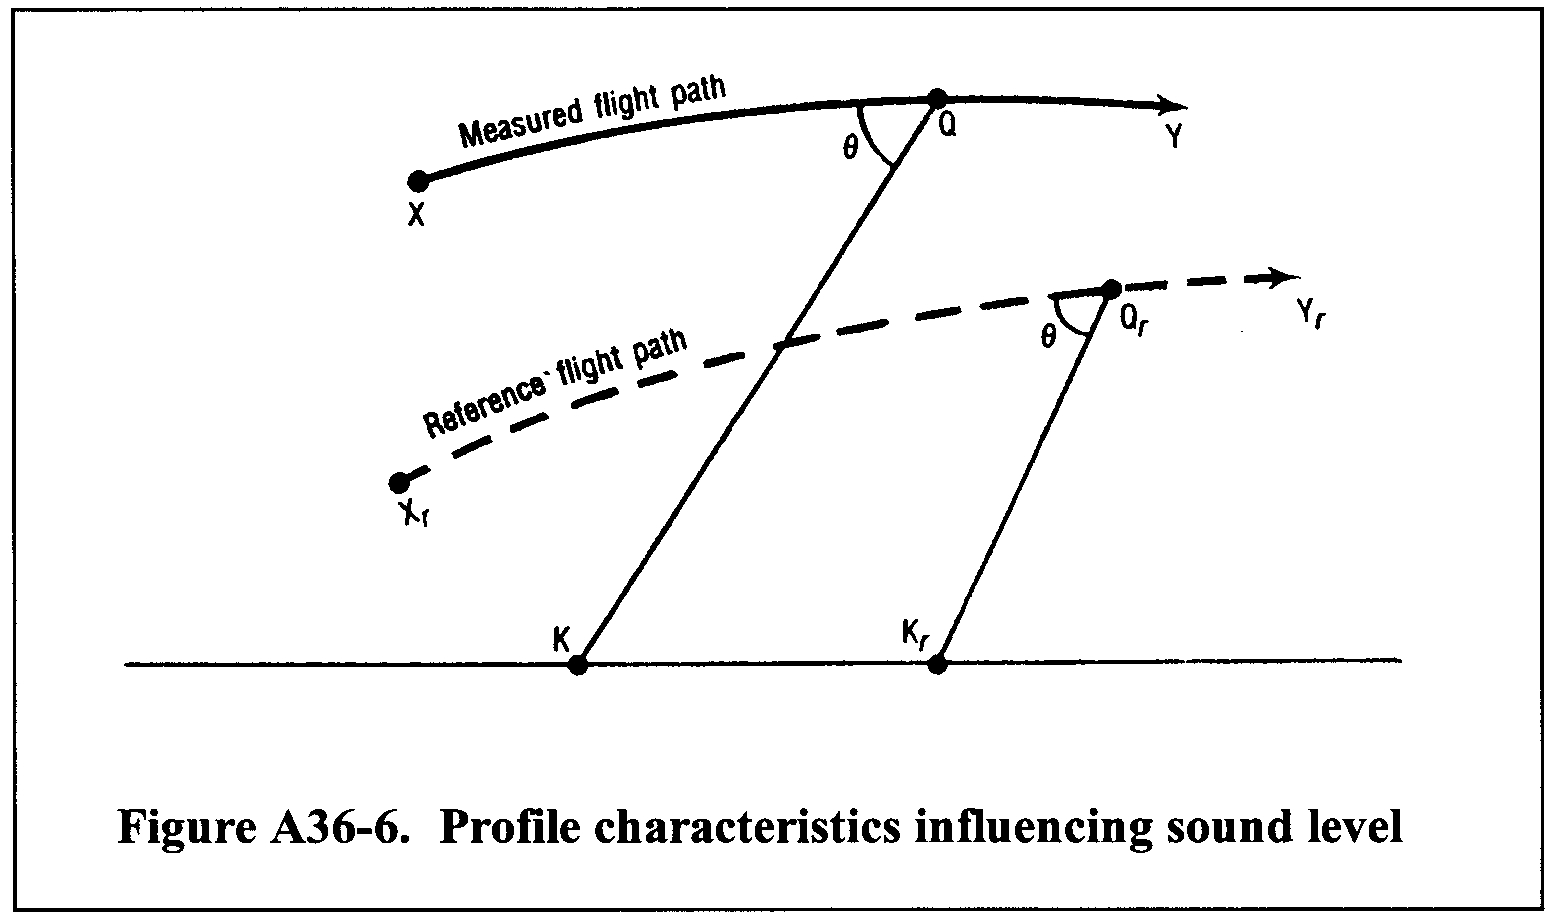
(a) The portions of the test flight path and the reference flight path described below, and illustrated in Figure A36-6, include the noise time history that is relevant to the calculation of flyover and approach EPNL. In figure A36-6:
(1) XY represents the portion of the measured flight path that includes the noise time history relevant to the calculation of flyover and approach EPNL; XrYr represents the corresponding portion of the reference flight path.
(2) Q represents the airplane's position on the measured flight path at which the noise was emitted and observed as PNLTM at the noise measuring station K. Qr is the corresponding position on the reference flight path, and Kr the reference measuring station. QK and QrKr are, respectively, the measured
and reference noise propagation paths, Qr being determined from the assumption that QK and QrKr form the same angle θ with their respective flight paths.
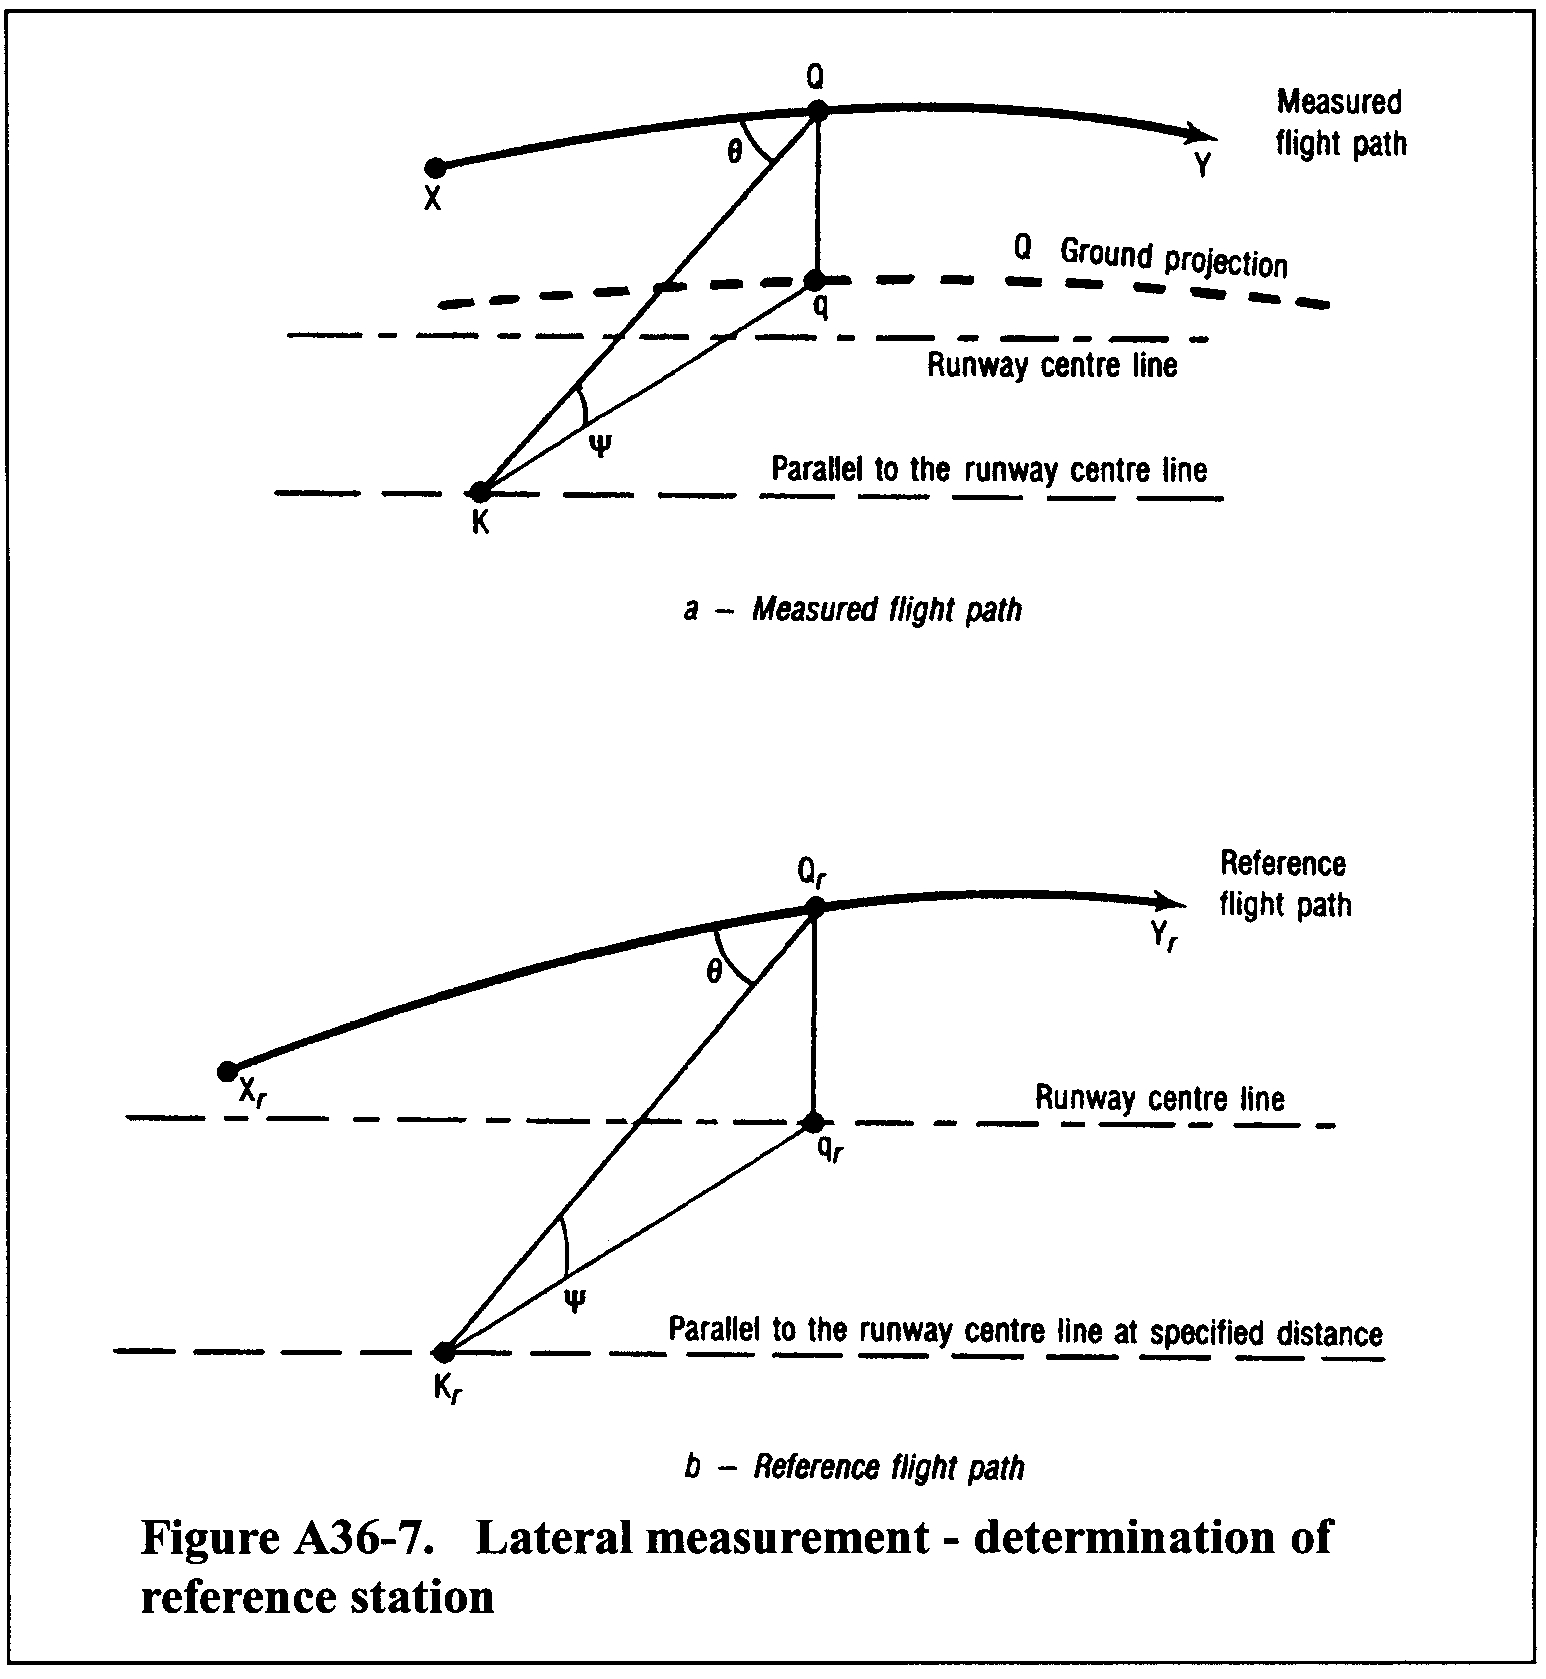
(b) The portions of the test flight path and the reference flight path described in paragraph (b)(1) and (2), and illustrated in Figure A36-7(a) and (b), include the noise time history that is relevant to the calculation of lateral EPNL.
(1) In figure A36-7(a), XY represents the portion of the measured flight path that includes the noise time history that is relevant to the calculation of lateral EPNL; in figure A36-7(b), XrYr represents the corresponding portion of the reference flight path.
(2) Q represents the airplane position on the measured flight path at which the noise was emitted and observed as PNLTM at the noise measuring station K. Qr is the corresponding position on the reference flight path, and Kr the reference measuring station. QK and QrKr are, respectively, the measured and reference noise propagation paths. In this case Kr is only specified as being on a particular Lateral line; Kr and Qr are therefore determined from the assumptions that QK and QrKr:
(i) Form the same angle θ with their respective flight paths; and
(ii) Form the same angle ψ with the ground.
Note:
For the lateral noise measurement, sound propagation is affected not only by inverse square and atmospheric attenuation, but also by ground absorption and reflection effects which depend mainly on the angle ψ.
A36.9.3.2.1 The one-third octave band levels SPL(i) comprising PNL (the PNL at the moment of PNLTM observed at K) must be adjusted to reference levels SPL(i)r as follows:
A36.9.3.2.1(a) For calculations using the English System of Units:
SPL(i)r = SPL(i) + 0.001[α(i)−α(i)0]QK
+ 0.001α(i)0(QK−QrKr)
+ 20log(QK/QrKr)
In this expression,
(1) The term 0.001[α(i)−α(i)0]QK is the adjustment for the effect of the change in sound attenuation coefficient, and α(i) and α(i)0 are the coefficients for the test and reference atmospheric conditions respectively, determined under section A36.7 of this appendix;
(2) The term 0.001α(i)0(QK − QrKr) is the adjustment for the effect of the change in the noise path length on the sound attenuation;
(3) The term 20 log(QK/QrKr) is the adjustment for the effect of the change in the noise path length due to the “inverse square” law;
(4) QK and QrKr are measured in feet and α(i) and α(i)0 are expressed in dB/1000 ft.
A36.9.3.2.1(b) For calculations using the International System of Units:
SPL(i)r = SPL(i) + 0.01[α(i)−α(i)0]QK
+ 0.01α(i)0 (QK − QrKr)
+ 20 log(QK/QrKr)
In this expression,
(1) The term 0.01[α(i) − α(i)0]QK is the adjustment for the effect of the change in sound attenuation coefficient, and α(i) and α(i)0 are the coefficients for the test and reference atmospheric conditions respectively, determined under section A36.7 of this appendix;
(2) The term 0.01α(i)0(QK − QrKr) is the adjustment for the effect of the change in the noise path length on the sound attenuation;
(3) The term 20 log(QK/QrKr) is the adjustment for the effect of the change in the noise path length due to the inverse square law;
(4) QK and QrKr are measured in meters and α(i) and α(i)0 are expressed in dB/100 m.
A36.9.3.2.1.1 PNLT Correction.
(a) Convert the corrected values, SPL(i)r, to PNLTr;
(b) Calculate the correction term Δ1 using the following equation:
Δ1 = PNLTr − PNLTM
A36.9.3.2.1.2 Add Δ1 arithmetically to the EPNL calculated from the measured data.
A36.9.3.2.2 If, during a test flight, several peak values of PNLT that are within 2 dB of PNLTM are observed, the procedure defined in section A36.9.3.2.1 must be applied at each peak, and the adjustment term, calculated according to section A36.9.3.2.1, must be added to each peak to give corresponding adjusted peak values of PNLT. If these peak values exceed the value at the moment of PNLTM, the maximum value of such exceedance must be added as a further adjustment to the EPNL calculated from the measured data.
A36.9.3.3 Adjustments to duration correction.
A36.9.3.3.1 Whenever the measured flight paths and/or the ground velocities of the test conditions differ from the reference flight paths and/or the ground velocities of the reference conditions, duration adjustments must be applied to the EPNL values calculated from the measured data. The adjustments must be calculated as described below.
A36.9.3.3.2 For the flight path shown in Figure A36-6, the adjustment term is calculated as follows:
Δ2 = −7.5 log(QK/QrKr) + 10 log(V/Vr)
(a) Add Δ2 arithmetically to the EPNL calculated from the measured data.
A36.9.3.4 Source noise adjustments.
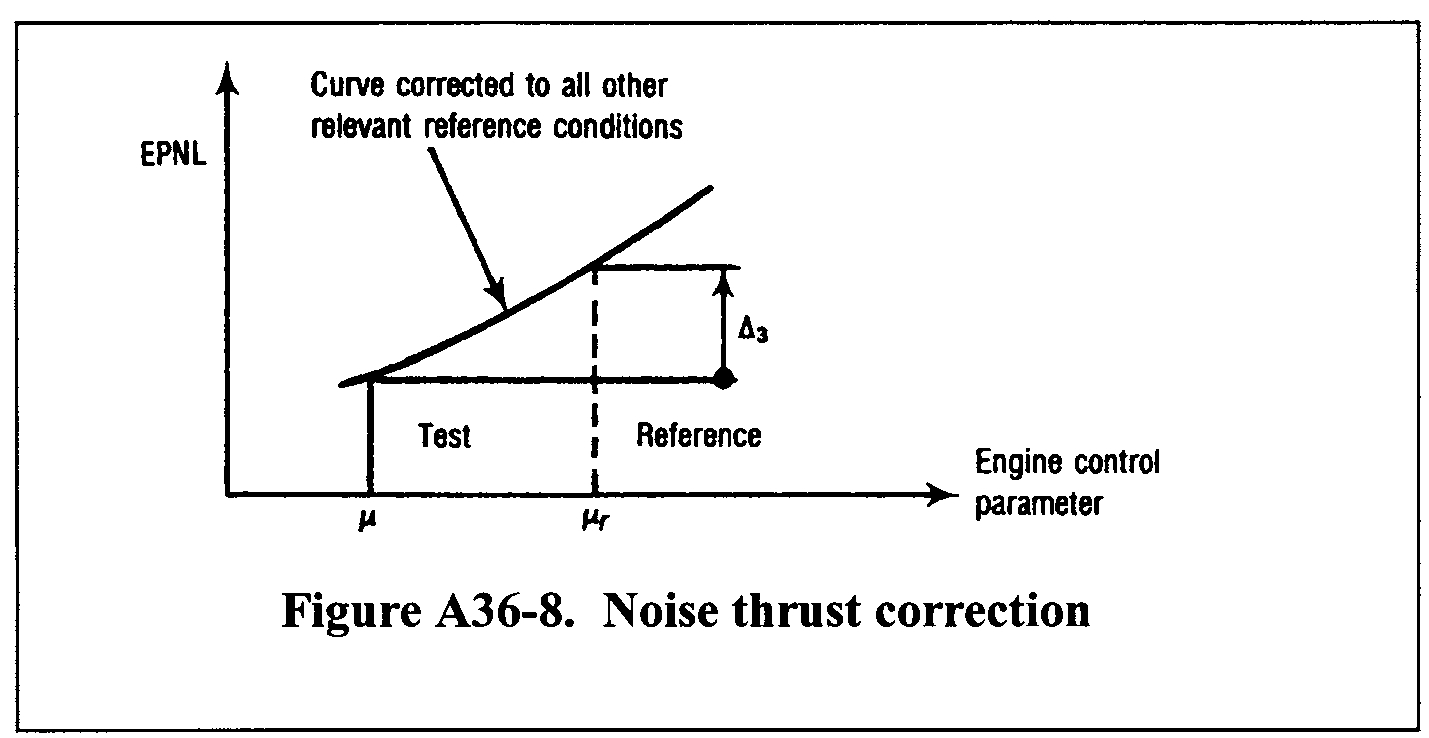
A36.9.3.4.1 To account for differences between the parameters affecting engine noise as measured in the certification flight tests, and those calculated or specified in the reference conditions, the source noise adjustment must be calculated and applied. The adjustment is determined from the manufacturer's data approved by the FAA. Typical data used for this adjustment are illustrated in Figure A36-8 that shows a curve of EPNL versus the engine control parameter μ, with the EPNL data being corrected to all the other relevant reference conditions (airplane mass, speed and altitude, air temperature) and for the difference in noise between the test engine and the average engine (as defined in section B36.7(b)(7)). A sufficient number of data points over a range of values of μr is required to calculate the source noise adjustments for lateral, flyover and approach noise measurements.
A36.9.3.4.2 Calculate adjustment term Δ3 by subtracting the EPNL value corresponding to the parameter μ from the EPNL value corresponding to the parameter μr. Add Δ3 arithmetically to the EPNL value calculated from the measured data.
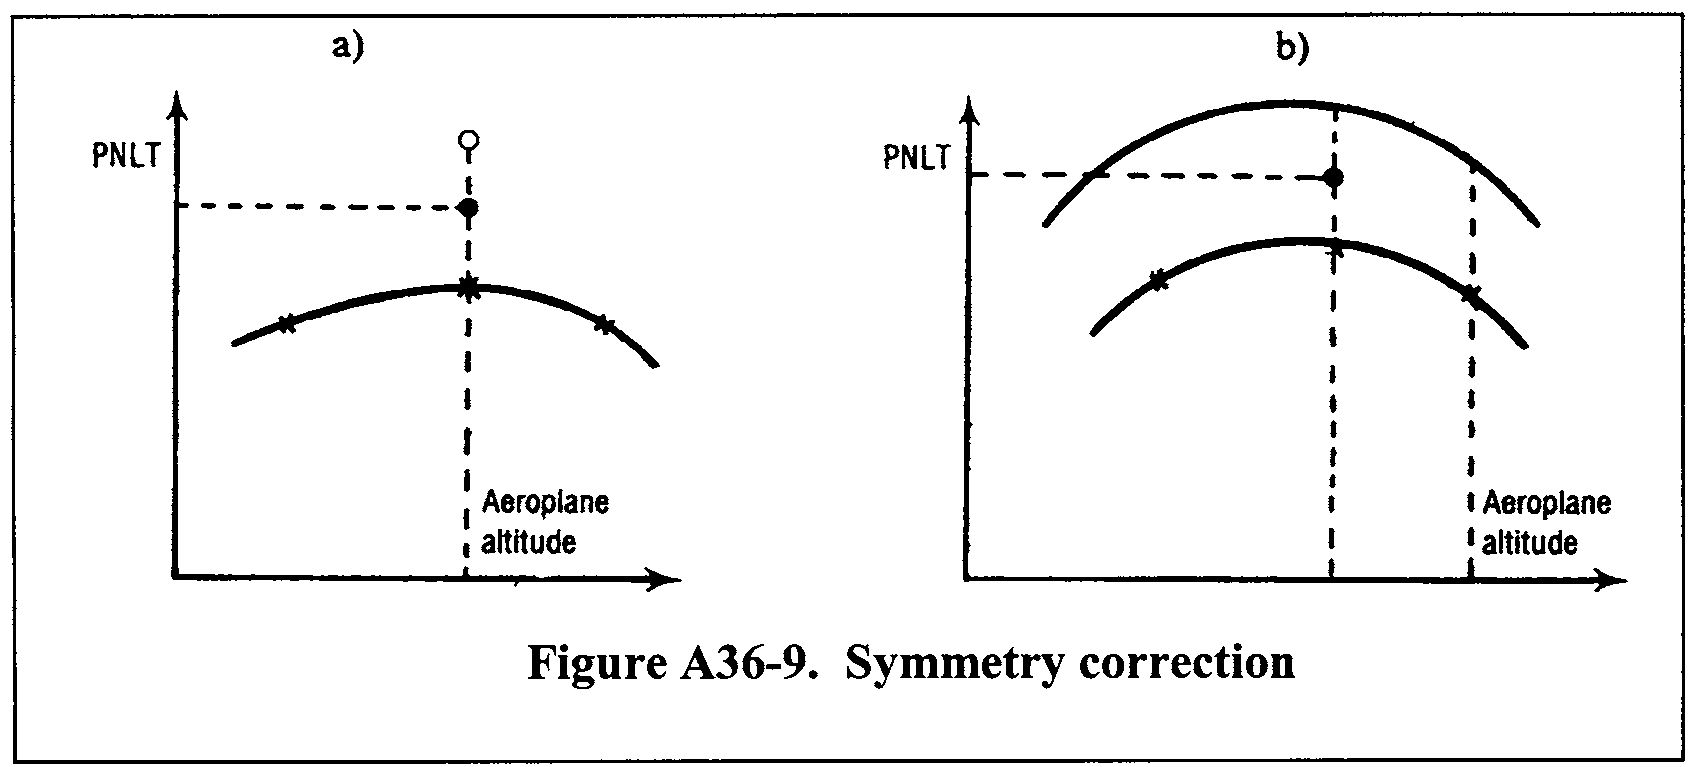
A36.9.3.5 Symmetry adjustments.
A36.9.3.5.1 A symmetry adjustment to each lateral noise value (determined at the section B36.4(b) measurement points), is to be made as follows:
(a) If the symmetrical measurement point is opposite the point where the highest noise level is obtained on the main lateral measurement line, the certification noise level is the arithmetic mean of the noise levels measured at these two points (see Figure A36-9(a));
(b) If the condition described in paragraph (a) of this section is not met, then it is assumed that the variation of noise with the altitude of the airplane is the same on both sides; there is a constant difference between the lines of noise versus altitude on both sides (see figure A36-9(b)). The certification noise level is the maximum value of the mean between these lines.
A36.9.4 Integrated method of adjustment
A36.9.4.1 General. As described in this section, the integrated adjustment method consists of recomputing under reference conditions points on the PNLT time history corresponding to measured points obtained during the tests, and computing EPNL directly for the new time history obtained in this way. The main principles are described in sections A36.9.4.2 through A36.9.4.4.1.
A36.9.4.2 PNLT computations.
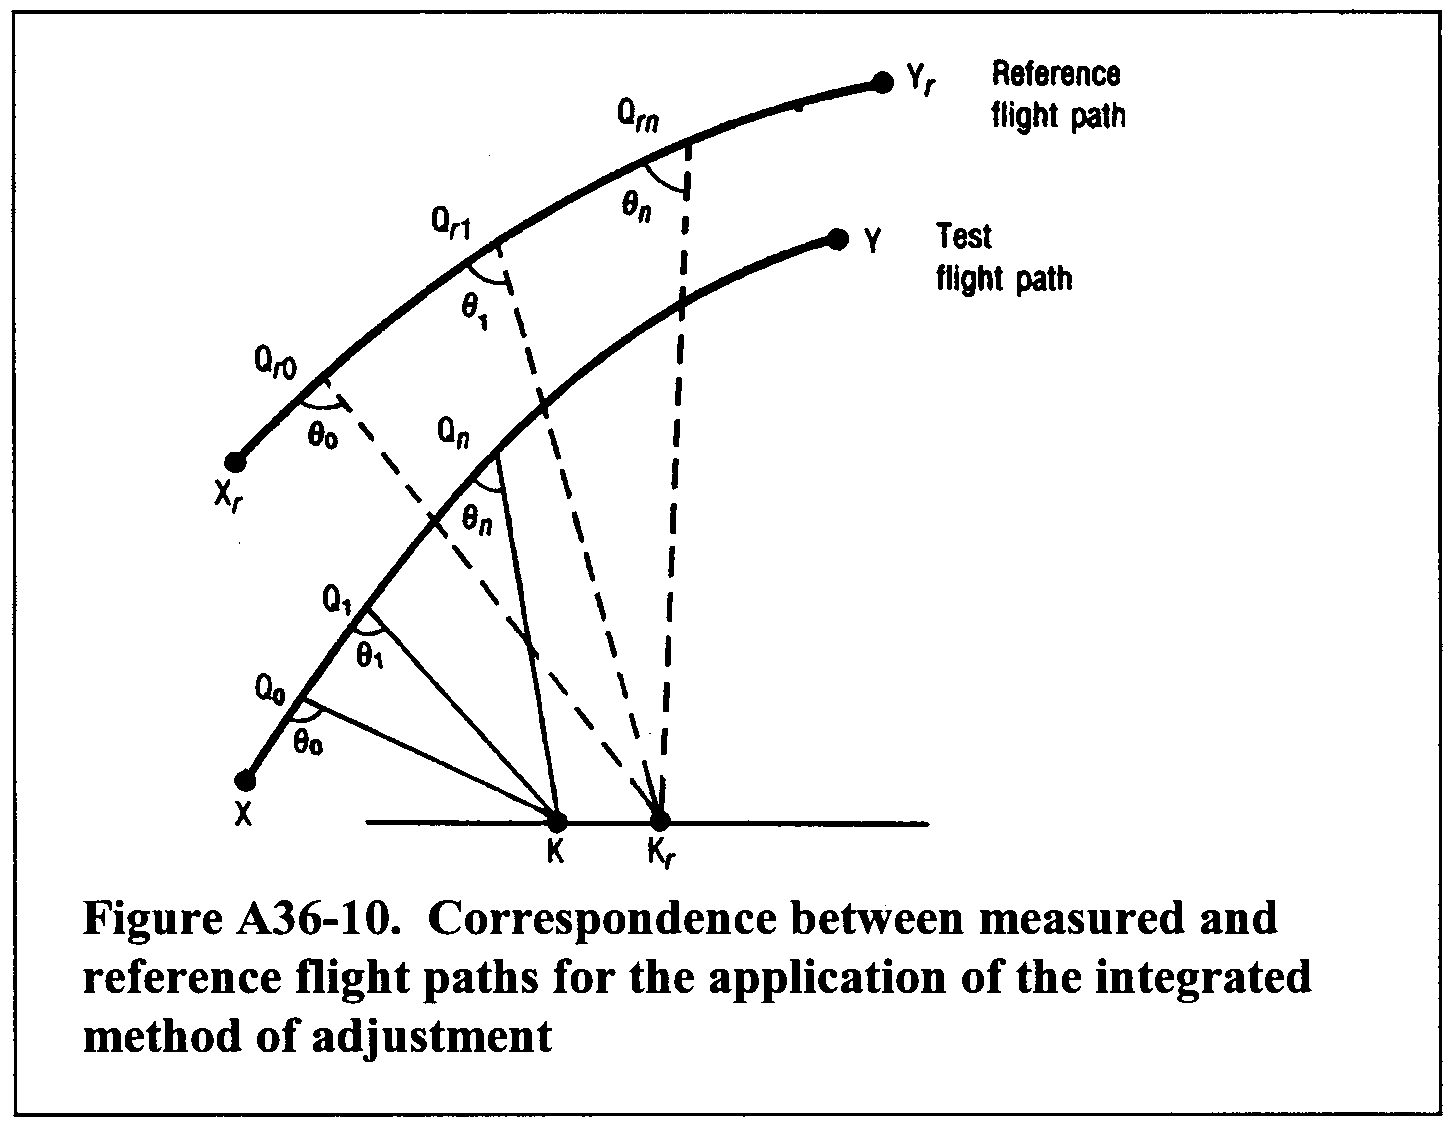
(a) The portions of the test flight path and the reference flight path described in paragraph (a)(1) and (2), and illustrated in Figure A36-10, include the noise time history that is relevant to the calculation of flyover and approach EPNL. In figure A36-10:
(1) XY represents the portion of the measured flight path that includes the noise time history relevant to the calculation of flyover and approach EPNL; XrYr represents the corresponding reference flight path.
(2) The points Q0, Q1, Qn represent airplane positions on the measured flight path at time t0, t1 and tn respectively. Point Q1 is the point at which the noise was emitted and observed as one-third octave values SPL(i)1 at the noise measuring station K at time t1. Point Qr1 represents the corresponding position on the reference flight path for noise observed as SPL(i)r1 at the reference measuring station Kr at time tr1. Q1K and Qr1Kr are respectively the measured and reference noise propagation paths, which in each case form the angle θ1 with their respective flight paths. Qr0 and Qrn are similarly the points on the reference flight path corresponding to Q0 and Qn on the measured flight path. Q0 and Qn are chosen so that between Qr0 and Qrn all values of PNLTr (computed as described in paragraphs A36.9.4.2.2 and A36.9.4.2.3) within 10 dB of the peak value are included.
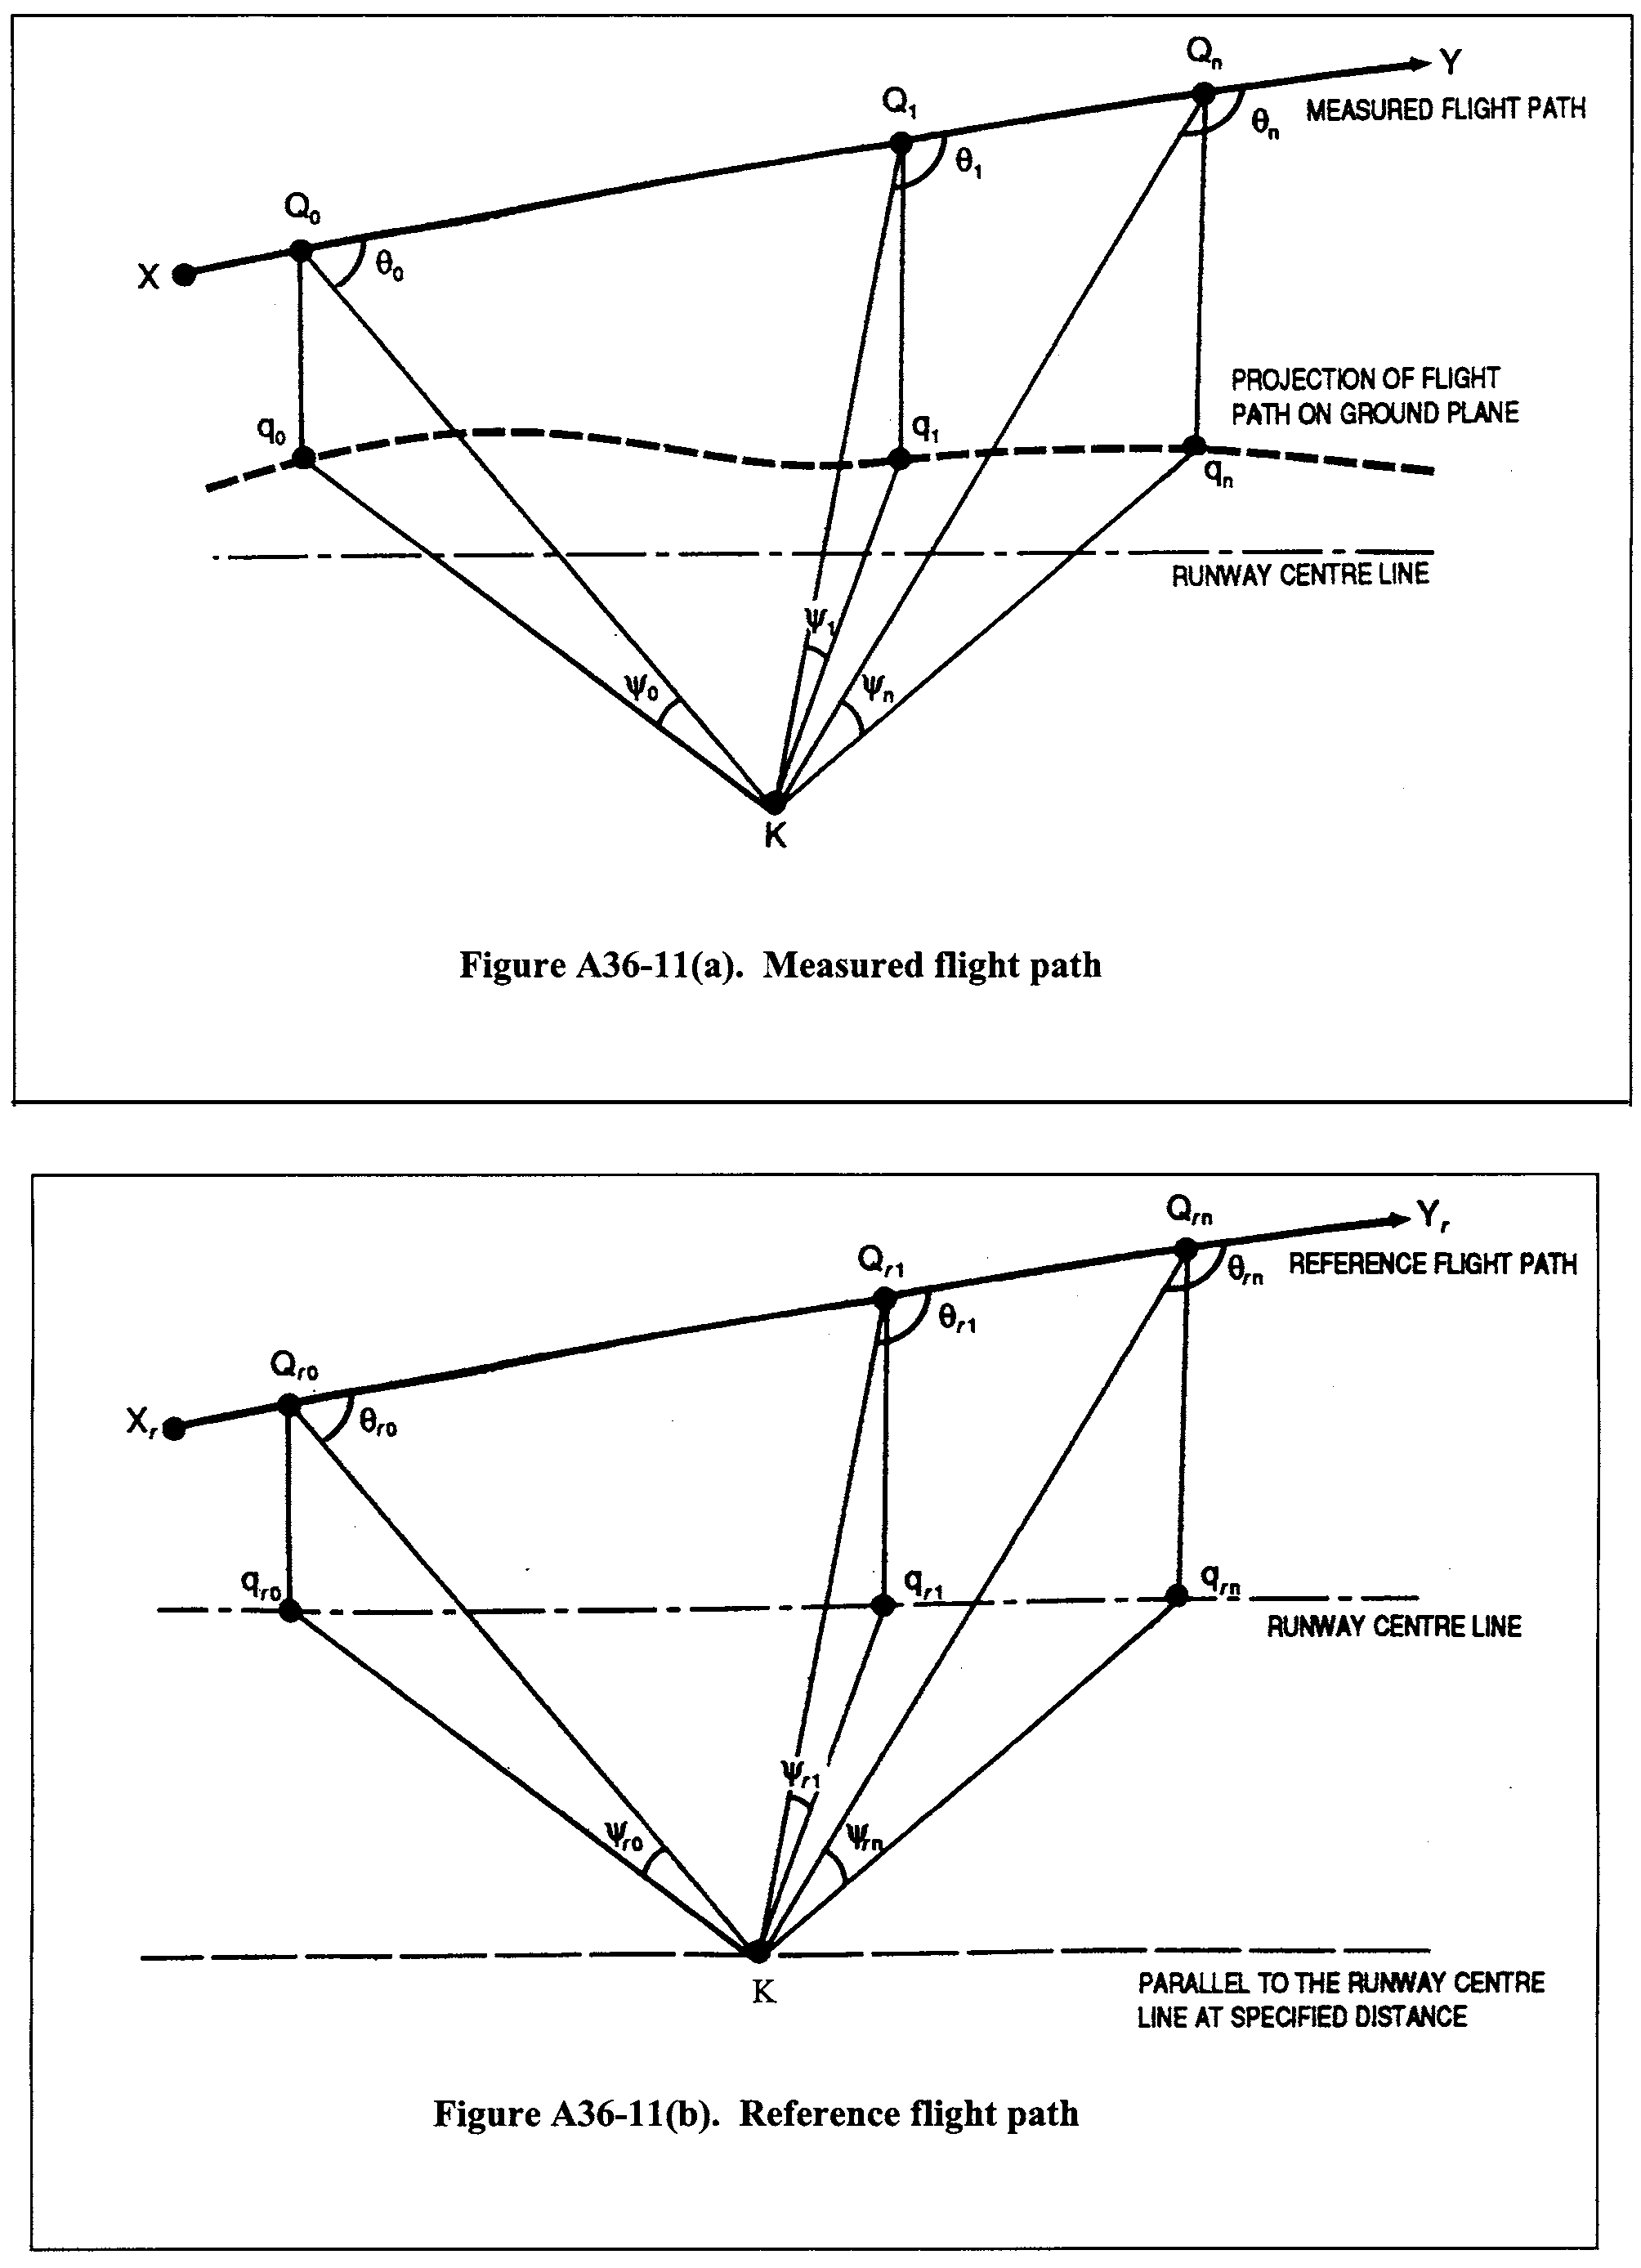
(b) The portions of the test flight path and the reference flight path described in paragraph (b)(1) and (2), and illustrated in Figure A36-11(a) and (b), include the noise time history that is relevant to the calculation of lateral EPNL.
(1) In figure A36-11(a) XY represents the portion of the measured flight path that includes the noise time history that is relevant to the calculation of lateral EPNL; in figure A36-11(b), XrYr represents the corresponding portion of the reference flight path.
(2) The points Q0, Q1 and Qn represent airplane positions on the measured flight path at time t0, t1 and tn respectively. Point Q1 is the point at which the noise was emitted and observed as one-third octave values SPL(i)1 at the noise measuring station K at time t1. The point Qr1 represents the corresponding position on the reference flight path for noise observed as SPL(i)r1 at the measuring station Kr at time tr1. Q1K and Qr1Kr are respectively the measured and reference noise propagation paths. Qr0 and Qrn are similarly the points on the reference flight path corresponding to Q0 and Qn on the measured flight path.
Q0 and Qn are chosen to that between Qro and Qrn all values of PNLTr (computed as described in paragraphs A36.9.4.2.2 and A36.9.4.2.3) within 10 dB of the peak value are included. In this case Kr is only specified as being on a particular lateral line. The position of Kr and Qr1 are determined from the following requirements.
(i) Q1K and Qr1Kr form the same angle θ1 with their respective flight paths; and
(ii) The differences between the angles 1 and r1 must be minimized using a method, approved by the FAA. The differences between the angles are minimized since, for geometrical reasons, it is generally not possible to choose Kr so that the condition described in paragraph A36.9.4.2(b)(2)(i) is met while at the same time keeping 1 and r1 equal.
Note:
For the lateral noise measurement, sound propagation is affected not only by “inverse square” and atmospheric attenuation, but also by ground absorption and reflection effects which depend mainly on the angle.
A36.9.4.2.1 In paragraphs A36.9.4.2(a)(2) and (b)(2) the time tr1 is later (for Qr1Kr >Q1K) than t1 by two separate amounts:
(1) The time taken for the airplane to travel the distance Qr1Qr0 at a speed Vr less the time taken for it to travel Q1Q0 at V;
(2) The time taken for sound to travel the distance Qr1Kr-Q1K.
Note:
For the flight paths described in paragraphs A36.9.4.2(a) and (b), the use of thrust or power cut-back will result in test and reference flight paths at full thrust or power and at cut-back thrust or power. Where the transient region between these thrust or power levels affects the final result, an interpolation must be made between them by an approved method such as that given in the current advisory circular for this part.
A36.9.4.2.2 The measured values of SPL(i)1 must be adjusted to the reference values SPL(i)r1 to account for the differences between measured and reference noise path lengths and between measured and reference atmospheric conditions, using the methods of section A36.9.3.2.1 of this appendix. A corresponding value of PNLr1 must be computed according to the method in section A36.4.2. Values of PNLr must be computed for times t0 through tn.
A36.9.4.2.3 For each value of PNLr1, a tone correction factor C1 must be determined by analyzing the reference values SPL(i)r using the methods of section A36.4.3 of this appendix, and added to PNLr1 to yield PNLTr1. Using the process described in this paragraph, values of PNLTr must be computed for times t0 through tn.
A36.9.4.3 Duration correction.
A36.9.4.3.1 The values of PNLTr corresponding to those of PNLT at each one-half second interval must be plotted against time (PNLTr1 at time tr1). The duration correction must then be determined using the method of section A36.4.5.1 of this appendix, to yield EPNLr.
A36.9.4.4 Source Noise Adjustment.
A36.9.4.4.1 A source noise adjustment, Δ3, must be determined using the methods of section A36.9.3.4 of this appendix.
A36.9.5 Flight Path Identification Positions
Position | Description |
|---|---|
A | Start of Takeoff roll. |
B | Lift-off. |
C | Start of first constant climb. |
D | Start of thrust reduction. |
E | Start of second constant climb. |
F | End of noise certification Takeoff flight path. |
G | Start of noise certification Approach flight path. |
H | Position on Approach path directly above noise measuring station. |
I | Start of level-off. |
J | Touchdown. |
K | Noise measurement point. |
Kr | Reference measurement point. |
K1 | Flyover noise measurement point. |
K2 | Lateral noise measurement point. |
K3 | Approach noise measurement point. |
M | End of noise certification Takeoff flight track. |
O | Threshold of Approach end of runway. |
P | Start of noise certification Approach flight track. |
Q | Position on measured Takeoff flight path corresponding to apparent PNLTM at station K See section A36.9.3.2. |
Qr | Position on corrected Takeoff flight path corresponding to PNLTM at station K. See section A36.9.3.2. |
V | Airplane test speed. |
Vr | Airplane reference speed. |
A36.9.6 Flight Path Distances
Distance | Unit | Meaning |
|---|---|---|
AB | Feet (meters) | Length of takeoff roll. The distance along the runway between the start of takeoff roll and lift off. |
AK | Feet (meters) | Takeoff measurement distance. The distance from the start of roll to the takeoff noise measurement station along the extended center line of the runway. |
AM | Feet (meters) | Takeoff flight track distance. The distance from the start of roll to the takeoff flight track position along the extended center line of the runway after which the position of the airplane need no longer be recorded. |
QK | Feet (meters) | Measured noise path. The distance from the measured airplane position Q to station K. |
QrKr | Feet (meters) | Reference noise path. The distance from the reference airplane position Qr to station Kr. |
K3H | Feet (meters) | Airplane approach height. The height of the airplane above the approach measuring station. |
OK3 | Feet (meters) | Approach measurement distance. The distance from the runway threshold to the approach measurement station along the extended center line of the runway. |
OP | Feet (meters) | Approach flight track distance. The distance from the runway threshold to the approach flight track position along the extended center line of the runway after which the position of the airplane need no longer be recorded. |
[Amdt. 36-54, 67 FR 45212, July 8, 2002; Amdt. 36-24, 67 FR 63195, 63196, Oct. 10, 2002; 68 FR 1512, Jan. 10, 2003; Amdt. 36-26, 70 FR 38749, July 5, 2005; FAA Doc. No. FAA-2015-3782, Amdt. No. 36-31, 82 FR 46131, Oct. 4, 2017]]